German Researchers Measure Rainfall by Studying Radio Waves
Published on by Water Network Research, Official research team of The Water Network in Academic
 Conventional approaches to studying rainfall patterns across both large distances and long timeframes suffer from a Goldilocks problem. For example, while a rain gauge may provide comprehensive precipitation data for a specific point on a near-constant basis, accurately capturing the variable nature of rainfall across a watershed may require researchers to deploy too many gauges to be practical. On the other hand, satellites and other large-area measurement methods often read rainfall at a specific point too infrequently to produce much useful data for municipalities, farmers, and meteorologists.
A research team from Karlsruhe Institute of Technology and the University of Augsburg, both in Germany, describes a new approach to rainfall measurement that involves studying the radio signals used by mobile phones. The approach demonstrates potential to measure rainfall over expansive areas with a minute-by-minute resolution. Image credit Wikipedia
According to new research from Germany’s Karlsruhe Institute of Technology (KIT) and University of Augsburg (UA), infrastructure that already exists in nearly every corner of the world may offer a solution that is just right.
Mobile-phone networks often rely on towers equipped with commercial microwave link (CML) antennas, which communicate via radio signals to coordinate calls across long distances. Rainstorms weaken these signals, and according to the research team, analyzing fluctuations in CML signal strength can translate into accurate rainfall measurements across both space and time.
“We have developed a completely new method for rain measurement from this interaction between weather events and human technology,” said KIT climatologist Harald Kunstmann in a release about the new research. “If a CML network is in place, we neither need new infrastructure nor additional ground staff.”
Stronger Readings From Weaker Signals
Partnering with a large, Swedish telecommunications company, the research team studied the radio frequencies emitted by nearly 4,000 CML antennas on a minute-by-minute basis for a year. The monitored CML network, which stretches across Germany, represents a diverse range of climate zones from the North German Plain to the Alps.
The measurement process begins by focusing on instances in which CML frequencies weaken to wavelengths between 15 to 40 GHz, which the researchers describe corresponds to the typical size of the raindrops that disrupt radio waves. By considering differences in signal strength alongside the location of specific CML antennas, the researchers developed Germany-wide precipitation maps estimating rainfall occurrence and volume as conditions changed.
However, simply monitoring for a specific wavelength did not provide sufficient information to infer rainfall accurately. Other factors, such as high winds, dew on CML antennas, or the refraction and reflection of ultraviolet light, can also weaken CML signals to the target range. Because eliminating the influence of these phenomena manually would take an enormous amount of time for a dataset of this size, the research team turned to artificial intelligence (AI).
Abstract
Quantitative precipitation estimation with commercial microwave links (CMLs) is a technique developed to supplement weather radar and rain gauge observations. It is exploiting the relation between the attenuation of CML signal levels and the integrated rain rate along a CML path. The opportunistic nature of this method requires a sophisticated data processing using robust methods. In this study we focus on the processing step of rain event detection in the signal level time series of the CMLs, which we treat as a binary classification problem. This processing step is particularly challenging, because even when there is no rain, the signal level can show large fluctuations similar to that during rainy periods. False classifications can have a high impact on falsely estimated rainfall amounts. We analyze the performance of a convolutional neural network (CNN), which is trained to detect rainfall-specific attenuation patterns in CML signal levels, using data from 3904 CMLs in Germany. The CNN consists of a feature extraction and a classification part with, in total, 20 layers of neurons and 1.4×10⁵ trainable parameters. With a structure inspired by the visual cortex of mammals, CNNs use local connections of neurons to recognize patterns independent of their location in the time series. We test the CNN's ability to recognize attenuation patterns from CMLs and time periods outside the training data. Our CNN is trained on 4 months of data from 800 randomly selected CMLs and validated on 2 different months of data, once for all CMLs and once for the 3104 CMLs not included in the training. No CMLs are excluded from the analysis. As a reference data set, we use the gauge-adjusted radar product RADOLAN-RW provided by the German meteorological service (DWD). The model predictions and the reference data are compared on an hourly basis. Model performance is compared to a state-of-the-art reference method, which uses the rolling standard deviation of the CML signal level time series as a detection criteria. Our results show that within the analyzed period of April to September 2018, the CNN generalizes well to the validation CMLs and time periods. A receiver operating characteristic (ROC) analysis shows that the CNN is outperforming the reference method, detecting on average 76 % of all rainy and 97 % of all nonrainy periods. From all periods with a reference rain rate larger than 0.6 mm h−1, more than 90 % was detected. We also show that the improved event detection leads to a significant reduction of falsely estimated rainfall by up to 51 %. At the same time, the quality of the correctly estimated rainfall is kept at the same level in regards to the Pearson correlation with the radar rainfall. In conclusion, we find that CNNs are a robust and promising tool to detect rainfall-induced attenuation patterns in CML signal levels from a large CML data set covering all of Germany.
How to cite.
Polz, J., Chwala, C., Graf, M., and Kunstmann, H.: Rain event detection in commercial microwave link attenuation data using convolutional neural networks, Atmos. Meas. Tech., 13, 3835–3853, https://doi.org/10.5194/amt-13-3835-2020, 2020.
1 Introduction
Rainfall is the major driver of the hydrologic cycle. Accurate rainfall observations are fundamental for understanding, modeling, and predicting relevant hydrological phenomena, e.g., flooding. Data from commercial microwave link (CML) networks have proven to provide valuable rainfall information. Given the high spatiotemporal variability of rainfall, they are a welcome complement to support traditional observations with rain gauges and weather radars, particularly in regions where radars are hampered by beam blockage or ground clutter. In regions with sparse rainfall observation networks, like in developing countries, CMLs might even be the only source of small-scale rainfall information.
Since the work by Messer et al. (2006) and Leijnse et al. (2007) more than a decade ago, several research groups have shown the potential of CML data for hydrometeorological usage. Prominent examples are the countrywide evaluations in the Netherlands (Overeem et al., 2016b) and Germany (Graf et al., 2020), which demonstrated that CML-derived rainfall information corresponds well with gauge-adjusted radar rainfall products, except for the cold season with solid precipitation. CML-derived rainfall information was also successfully used for river runoff simulations in a pre-alpine catchment in Germany (Smiatek et al., 2017) and for pipe flow simulation in a small urban catchment in the Czech Republic (Pastorek et al., 2019). A further important step was the first analysis of CML-derived rain rates in a developing country, carried out by Doumounia et al. (2014), with data from Burkina Faso.
In general, the number of CMLs available for research has increased significantly over the last years and researchers from several countries have gained access to CML attenuation data. Currently, data from 4000 CMLs all over Germany are recorded continuously with a temporal resolution of 1 min via a real-time data acquisition system (Chwala et al., 2016). The number of existing CMLs across Germany is more than 30 times higher (Bundesnetzagentur, 2017), amounting to 130 000 registered CMLs. Consequently, it is envisaged to increase the number of CMLs included in the data acquisition.
With this large number of CMLs available in Germany and with new data being retrieved continuously, there is a need for optimized and robust processing of such a big data set. Several studies address the details of the processing steps which are required for deriving rainfall information from CMLs. These steps involve, for example, the detection of rain events in noisy raw data, the filtering of artifacts, correcting for bias due to wet antenna attenuation (WAA), and the spatial reconstruction of rainfall fields. Uijlenhoet et al. (2018) give a general overview of the required processing steps and the existing methods, and Chwala and Kunstmann (2019) discuss and summarize the related current challenges.
1.1 On the importance of rain event detection
The first of these processing steps, called rain event detection, is the separation of rainy (wet) and nonrainy (dry) periods. A static signal-level baseline to derive attenuation that can be attributed to rainfall has proven to be ineffective due to, for example, daily or annual cycles and unexpected jumps in the time series like for CML B in Fig. 1. After the rain events are localized correctly, an event-specific attenuation baseline can be determined and actual rain rates can be derived via the k – R power law which relates specific attenuation k (in dB km−1) to rain rate R (in mm h−1).
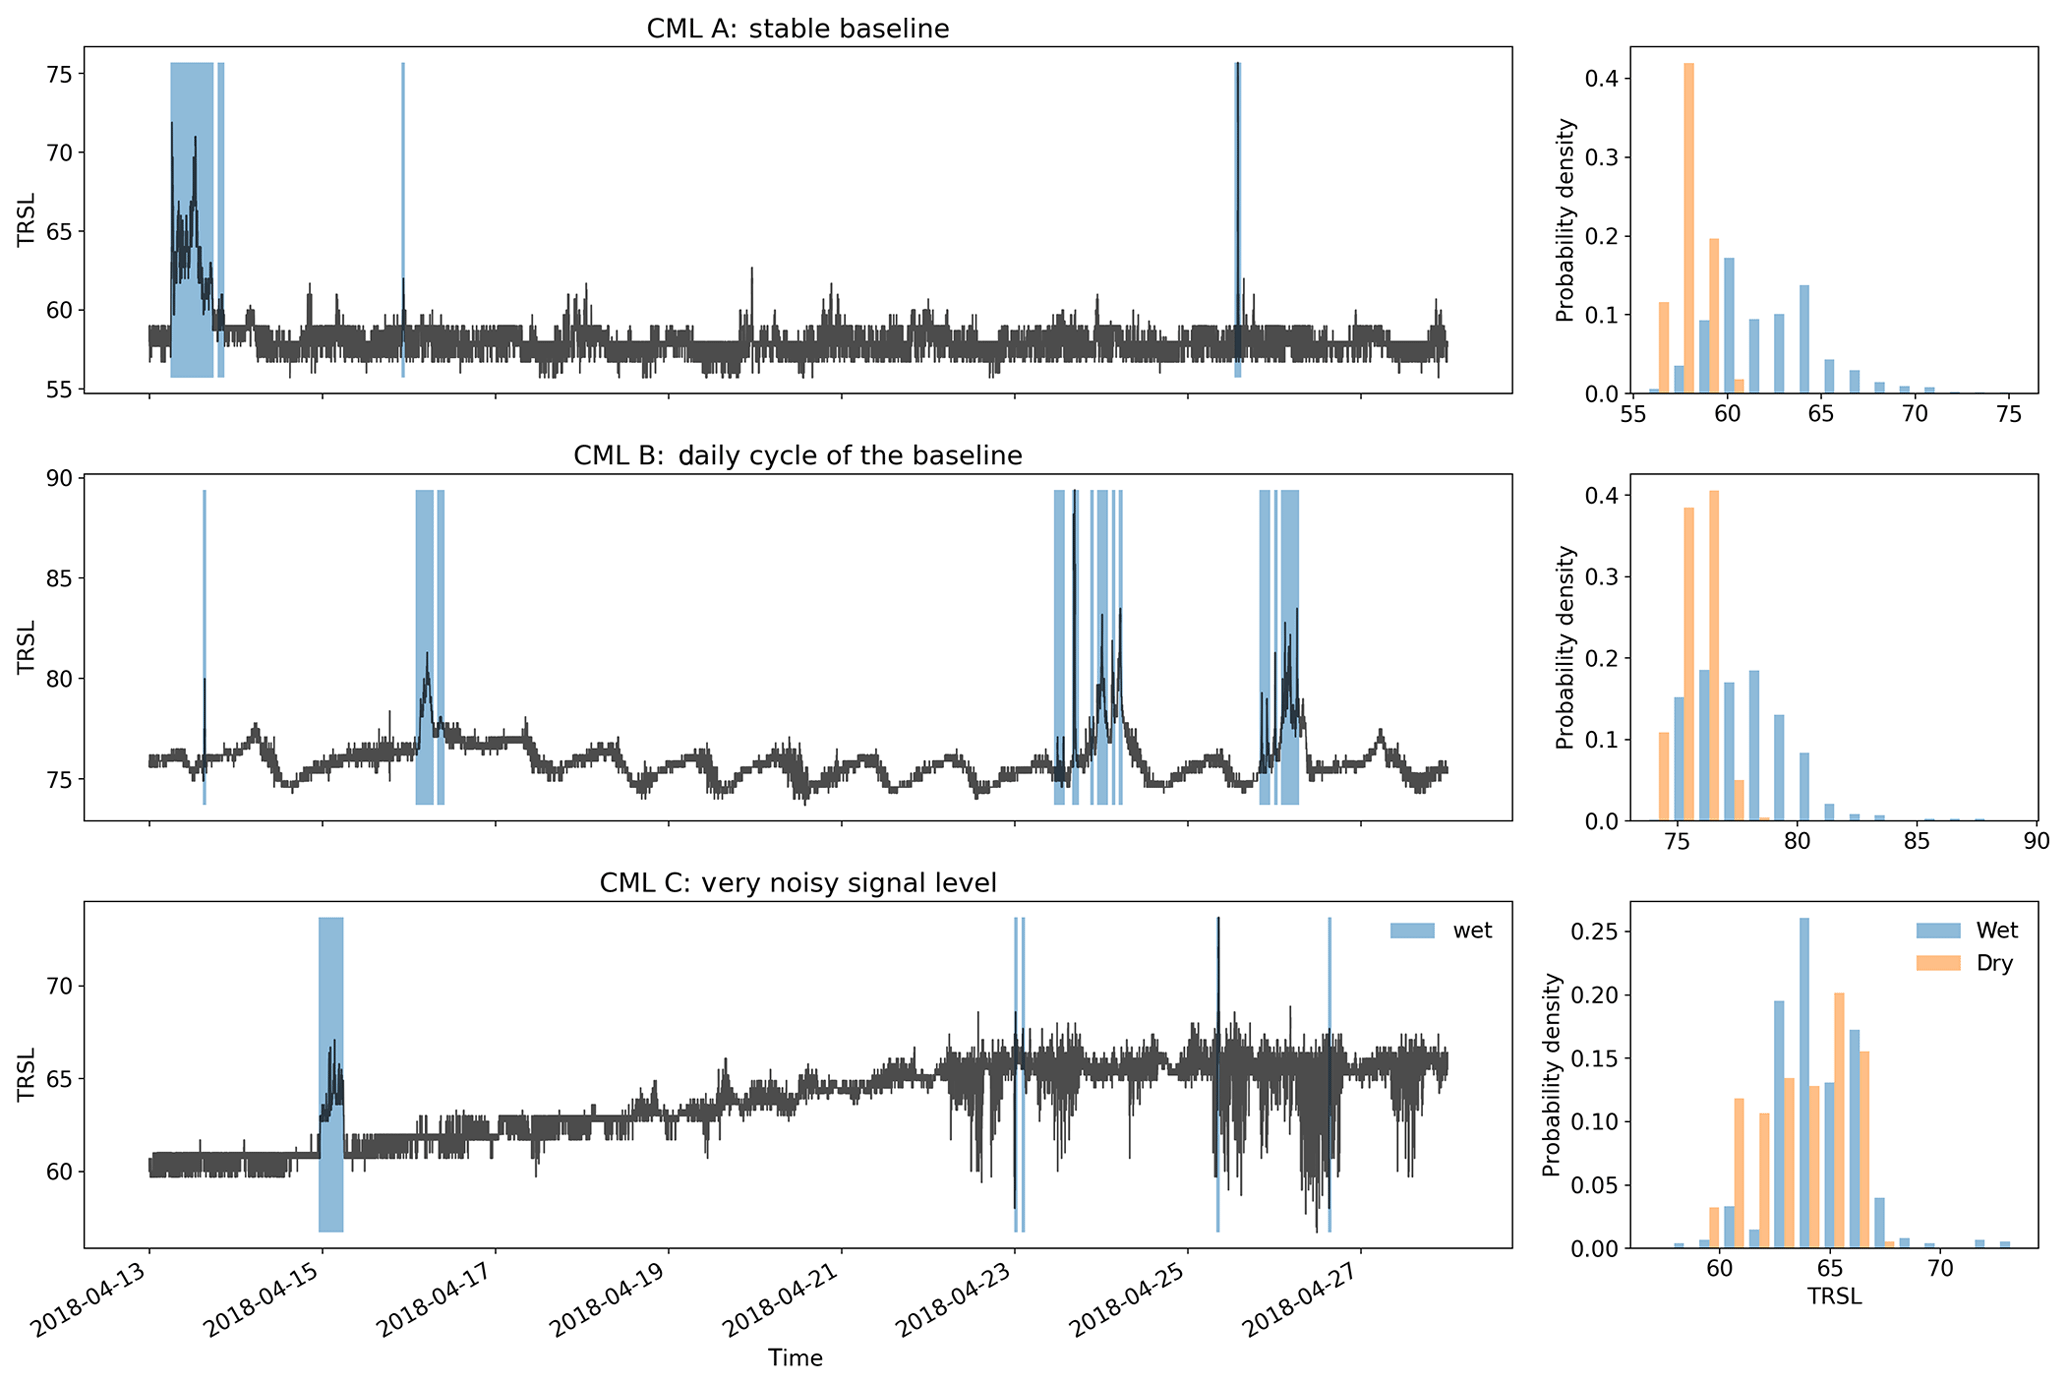
Figure 1 Three example signal level (TRSL) time series that illustrate the high variability in data quality when comparing different CMLs. The blue shaded periods indicate where the radar reference shows rainfall along the CML paths. The challenge is to identify these periods by analyzing the time series. Note that each attenuation event that is falsely classified as wet will produce false rain rate estimates, which will lead to overestimation. The histograms show that for some CMLs the wet periods can be easily separated from the dry periods and for others the distribution of TRSL values is nearly identical for both classes. Figure 2 below will show an example of how different detection methods deal with the challenging time series of CML C.
Detecting rain events is challenging, because CML signal levels can show high fluctuations, even when there is no rain, e.g., due to multipath propagation (e.g., Chwala and Kunstmann, 2019, Fig. 6). Therefore, the main difficulty is to distinguish between noise and signal fluctuations caused by rain along the CML path. As seen in Fig. 1, the differences in noise levels can vary significantly, depending on the CML that is used. When looking at the magnitude of these fluctuations, we can see that a misclassification of wet and dry periods can easily lead to a large over- or underestimation of rainfall. These missed or falsely estimated quantities are often overlooked in scatter density comparisons of rainfall products like Fig. 9a and b below, which shows our own results. But when absolute amounts are compared, they represent an obvious issue with up to 30 % of the total CML rainfall that can be attributed to false positives. As these misclassifications generate a bias different from the bias corrected in later processing steps like the WAA correction, it is important to optimize the rain event detection as an isolated processing step first and to optimize subsequent processing steps afterwards.
1.2 State of the art
So far, several methods for rain event detection with CMLs have been proposed. The main difference that divides these methods into two groups, is the type of CML data that can be used to estimate rainfall. Depending on the available data acquisition, CML signal levels are either instantaneously sampled at a rate ranging from a few seconds up to 15 min or they are stored as 15 min minimum and maximum values derived from a high instantaneous sampling rate in the background. In almost all cases only one of the two sampling strategies is available due to the type of data management through the network provider. The resulting rain event detection methods are highly optimized for one kind of sampling strategy and therefore in general incompatible with the other kind.
The following methods were developed for instantaneous measurements: Schleiss and Berne (2010) introduced a threshold for the rolling standard deviation (RSD) of the attenuation time series as a criterion to detect rain events. Despite being one of the first methods that were developed, it is still the most commonly used within the CML research community, as it was used in very recent studies from different working groups such as Kim and Kwon (2018), Graf et al. (2020), or Fencl et al. (2020). Chwala et al. (2012) introduced Fourier transformations on a rolling window of CML signal levels to detect the pattern of rain events in the frequency domain. Wang et al. (2012) used a Markov switching model, which was calibrated and validated for a single CML test site. Kaufmann and Rieckermann (2011) have shown the applicability of random forest classifiers and Gaussian factor graphs and validated their approach using 14 CMLs. Ðorđević et al. (2013) used a simple multilayer perceptron (MLP) which was trained and validated on a single CML. Ostrometzky and Messer (2018) proposed a simple rolling mean approach to determine a dynamic baseline, also validated on a single CML. Most of these studies are based on a comparably low and sometimes preselected amount of CMLs ranging from 1 to a maximum of 50 devices, a number that is likely much larger in a possible operational setting.
As a detection scheme for 15 min min and max sampled data with a 10 Hz background sampling rate, Overeem et al. (2011) introduced the “nearby link approach”. A period is considered wet if the increase in CML-specific attenuation correlates with the attenuation pattern of nearby CMLs. They concluded that this is only applicable for dense CML networks with a high data availability. Later, they conducted the first evaluation of a rain event detection method on data from 2044 CMLs on a country scale (Overeem et al., 2016b). Very recently the same approach was used in de Vos et al. (2019), showing that this approach works better in combination with min and max sampling than with 15 min instantaneous sampling. Habi and Messer (2018) tested the performance of long short-term memory (LSTM) networks to classify rainy periods from 15 min min and max values of CML signal levels for 34 CMLs.
All rain event detection methods have to make a similar trade-off: a liberal detection of wet periods is more likely to recognize even small rain rates, while it will produce more false alarms during dry periods. On the other hand, a conservative detection will accurately classify dry periods but is more likely to miss small rain events. One can address this by two means: by increasing detection rates on both wet and dry periods as much as possible and therefore decreasing the impact of the trade-off and by allowing the flexibility to easily adjust the model towards liberal or conservative detection, e.g., by only changing a single parameter.
In conclusion, until now, there have been few studies analyzing the performance of rain event detection methods on large data sets. Overeem et al. (2016b) tested the nearby link approach using 2044 CMLs distributed over the Netherlands with a temporal coverage of 2.5 years of data. Graf et al. (2020) extended the RSD method and applied it to 1 year of data from 3904 CMLs to set a benchmark performance on the same data set used in this study. By optimizing thresholds for individual CMLs, the full potential of the RSD method for 1 year of data was explored, yielding good results for the warm season with liquid precipitation. While the RSD method is simple to implement and has only two parameters (window length and threshold) to optimize, it is limited to measuring the amount of fluctuations rather than the specific pattern. More room for optimization is expected using a data-driven approach, such as machine learning techniques for pattern recognition.
1.3 Data-driven optimization through deep learning
Deep learning is a rapidly evolving field that is becoming increasingly popular in the earth system sciences. A large field of application is remote sensing using artificial neural networks for image recognition (Zhu et al., 2017). Deep learning is also an established method in time series classification (Fawaz et al., 2019). In both studies, convolutional neural networks (CNNs) are considered one of the leading neural network architectures for image and time series classification. CNNs are inspired by the visual cortex of mammals, and they are designed to recognize objects or patterns, regardless of their location in images or time series (Fukushima, 1980). They are characterized by local connections of neurons, shared weights, and a large number of layers of neurons, involving pooling layers (LeCun et al., 2015). CNNs with one-dimensional input data (1D CNNs) have already been used for time series classification, e.g., for classifying environmental sounds (Piczak, 2015). This makes 1D CNNs a promising candidate for the task of rain event detection in CML signal levels.
1.4 Research gap and objectives
Due to the opportunistic use of CMLs, the variety of signal fluctuations and possible occurrences of errors naturally increase in a CML data set with its size. Separating rainy from nonrainy periods is therefore a crucial step for rainfall estimation from CMLs. Although applicable on a large scale, recently applied methods still struggle with falsely estimated rainfall as can be seen in the evaluations from Graf et al. (2020) and de Vos et al. (2019). Despite the amount of proposed methods, this processing step has not yet been investigated in detail using a large and diverse CML data set, especially for data-driven approaches. Given their promising results in other applications, the usage of artificial neural networks (ANNs) for rain event detection in the CML attenuation time series on a large scale provides a promising opportunity. It has been proven that in many cases ANNs allow for fast, robust, and high-performance processing of a variety of suitable data sets. What is missing is a proof that they are applicable to a large and diverse CML data set. The question is this: does a high variability of frequency, length, and spatial distribution of the analyzed CMLs or a high variability of rain rates and event duration for a large amount of analyzed periods affect the performance of ANNs in this specific case or not? Additionally, the effect of rain event detection performance on the estimated rain rates has yet to be investigated.
The objective of this study is to evaluate the performance of 1D CNNs to detect rainfall-induced attenuation patterns in instantaneously measured CML signal levels and to investigate the effect of an improved temporal event localization on the CML-derived rainfall amounts. Furthermore, we test the CNN's ability to transfer its detection performance to new CMLs and future time periods in order to provide a validated open-source model that can be used on other data sets. To provide the CML community with comprehensible results, we compare the CNN to the method of Schleiss and Berne (2010), which we consider to be state of the art due to the amount of recent applications. We aim to provide a high statistical robustness of the derived performance measures by using the, to date, largest available CML data set consisting of data from 3904 CMLs distributed over all of Germany.
Taxonomy
- Test & Measurement
- Measurement
- Rain Water Management
- Rainwater Harvesting