How Predictive Analytics Curtails Water Loss and Prevents Collateral Damage from Hidden Leaks
Published on by Water Network Research, Official research team of The Water Network in Case Studies
Background:
Sydney Water, Australia’s largest water utility, supplies water, wastewater, recycled water and some Stormwater services to more than five million people in Sydney, the Illawarra and the Blue Mountains. Covering 12,700 km2, the network comprises over 21,000 kilometers of water pipes, 251 reservoirs and 164 pumping stations.
The Australian utility has been using TaKaDu’s Central Event Management (CEM) solution since 2015 to reduce water loss and improve its operational efficiency, as part of its commitment to provide valued water solutions to its customers and maintain high levels of service.
The Customer Hub team focuses on being both proactive in its communications with customers and predictive in the way they operate their assets. Much of the predictive work is done to carry out customer impact assessments and act to avoid or minimize customer impact, identifying problems before they affect the customers. They have had great results with this approach – since Sep 2017 they have been able to avoid or minimize water interruptions to over 140,000 properties that would have otherwise been affected.
TaKaDu’s software service plays a key role, enabling them to make optimum use of the vast amounts of their telemetry data, monitor the network and identify problems before customers even notice them. Using TaKaDu, the team can strengthen their predictive capability by conducting real-time analysis of flow and pressure data, identifying when something unusual happens.

Unusual flow event signifying a hidden leak:
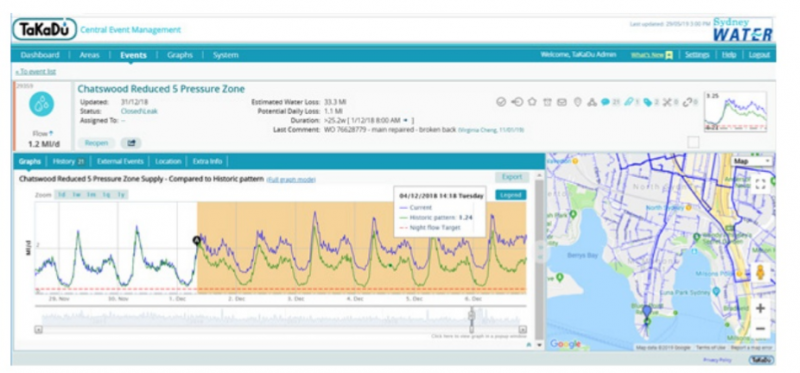
Leveraging TaKaDu’s advanced statistical algorithms and machine learning, the Customer Hub team identify deviations from predicted patterns in parts of the network. On 1 December 2018, Takadu identified an unusual flow trend event in the zone covering the North Sydney, McMahons Point area. The following flow trend plot shows the pattern into the water zone over several days.
As there had been no reported leaks in the area, the team initiated a leak investigation using Sydney Water network technicians. They used acoustic listening equipment to listen to the network at selected points within the zone and easily located a hidden leak adjacent to Sydney Harbour. The leak was completely invisible to the public, with the water making its way under the road surface and straight into the harbor.
Darren Cash, Customer Hub Manager, Sydney Water, explained, “The leak was losing 1.3 million litres per day
– enough water to fill an Olympic size swimming pool every 36 hours! If we were to rely on the old way of detecting such leaks (i.e. wait for our customers to report), it would have continued for a prolonged period, losing almost $1M worth of water every 12 months (based on what our customers pay). It may also have grown to a main break, which would have caused a large customer impact.”
Summary :
This event reconfirmed to Sydney Water how they can effectively use data or monitoring to identify issues before its customers do, serving as an introduction to “a more predictive future” with their different departments working together to resolve the problem. By alerting the Customer Hub team to the irregular flow event, TaKaDu enabled them to prevent significant NRW loss and collateral damage. The entire life-cycle of the event was managed quickly and effectively via the centralized platform.
Media
Taxonomy
- Leakage Detection
- Leakage
- Infrastructure
- Leakage Reduction
- Condition Assessment
- Intelligent Networks
- Storm Water Management
- Infrastructure Management
- Water Loss Control
- Multi-Sensor Pipelines
- Smart Water
- pipeline leak detection
- Pipes and Pipelines