Measurement of SARS-CoV-2 RNA in wastewater tracks community infection dynamics
Published on by Water Network Research, Official research team of The Water Network in Academic
Researchers at Yale University found that testing "sewer sludge" in wastewater for coronavirus could detect an outbreak more than a week earlier than traditional contact tracing.
In the study, published last week in the journal Nature Biotechnology, researchers began taking daily samples from a New Haven-area wastewater treatment plant, which serves multiple towns in Connecticut including New Haven, East Haven, Hamden and parts of Woodbridge.
The study’s results, which span 10 weeks from March 19 to June 1, found that testing sewers for Covid-19 — collecting samples from the "primary sewage sludge" of settled solids — produces transmission trends that are “very similar” to those of contact tracing, but come about “six to eight” days earlier. SEE PAPER ATTACHED
PAPER INTRODUCTION
We measured severe acute respiratory syndrome coronavirus 2 (SARS-CoV-2) RNA concentrations in primary sewage sludge in the New Haven, Connecticut, USA, metropolitan area during the Coronavirus Disease 2019 (COVID-19) outbreak in Spring 2020. SARS-CoV-2 RNA was detected throughout the more than 10-week study and, when adjusted for time lags, tracked the rise and fall of cases seen in SARS-CoV-2 clinical test results and local COVID-19 hospital admissions. Relative to these indicators, SARS-CoV-2 RNA concentrations in sludge were 0–2 d ahead of SARS-CoV-2 positive test results by date of specimen collection, 0–2 d ahead of the percentage of positive tests by date of specimen collection, 1–4 d ahead of local hospital admissions and 6–8 d ahead of SARS-CoV-2 positive test results by reporting date. Our data show the utility of viral RNA monitoring in municipal wastewater for SARS-CoV-2 infection surveillance at a population-wide level. In communities facing a delay between specimen collection and the reporting of test results, immediate wastewater results can provide considerable advance notice of infection dynamics.
Main
The progression of the COVID-19 pandemic has been monitored primarily by testing symptomatic individuals for the presence of SARS-CoV-2 RNA and counting the number of positive tests over time1. However, in the United States and other countries, the spread of COVID-19 has commonly exceeded the testing capacity of public health systems. Moreover, test results are a lagging indicator of the pandemic’s progression2,3, because testing is usually prompted by symptoms, which might take 2 weeks to present after infection4, and delays occur between the appearance of symptoms, testing and the reporting of test results. Monitoring sewage in a community’s collection or treatment system has been used previously to provide early surveillance of disease prevalence at a population-wide level, notably for polio5,6, and might be similarly beneficial for the current COVID-19 pandemic. SARS-CoV-2 RNA is present in the stool of patients with COVID-19 (refs. 7,8,9) and in raw wastewater10,11,12, and increased RNA concentrations in raw wastewater have been recently associated with increases in reported COVID-19 cases11. However, the utility of wastewater SARS-CoV-2 concentrations for tracking the progression of COVID-19 infections is poorly understood. In this study, we investigated how viral RNA concentrations in wastewater correlated with compiled testing and hospitalization data in a U.S. metropolitan area over ~10 weeks, corresponding to a first wave of SARS-CoV-2 infection.
When municipal raw wastewater discharges into treatment facilities, solids are settled and collected into a matrix called primary sewage sludge. We chose to analyze primary sludge rather than raw wastewater because it provides a high-solids-content, mixed sample that has been shown to contain a broad diversity of human viruses, including commonly circulating coronavirus strains13. During the COVID-19 outbreak, from March 19, 2020, to June 1, 2020, in the New Haven, Connecticut, metropolitan area, we collected daily primary sludge samples from the wastewater treatment facility, which serves ~200,000 residents. We quantitatively compared SARS-CoV-2 RNA concentrations in sludge with publicly reported data on four other measures of the outbreak: SARS-CoV-2 positive test results by date of specimen collection; the percentage of positive SARS-CoV-2 test results (test positivity) by date of specimen collection; the number of local hospital admissions of patients with COVID-19; and SARS-CoV-2 positive test results by reporting date.
We measured SARS-CoV-2 virus RNA by quantitative reverse transcription polymerase chain reaction (qRT–PCR) using the same N1 and N2 primer sets employed in COVID-19 individual testing. Virus RNA copies ranged from 1.7 × 10³ ml−1 to 4.6 × 10⁵ ml−1 of primary sludge. All qRT–PCR concentration threshold (Ct) values were below 40, and 97% of all samples had a Ct value less than 38. The average Ct was 34.6 for N1 primers and 34.5 for N2 primers. Values for each replicate were reported as positive only when the human ribonuclease P ( RP ) internal control gene was positive. The average (s.d.) Ct value for the RP gene for all positive samples was 36.2 (1.2) for replicate 1 and 36.2 (1.3) for replicate 2. Replicated samples demonstrated similar SARS-CoV-2 RNA concentration values (Fig. 1). Concentration comparisons between replicates produced slopes of 0.99 ( R 2 = 0.75) for N1 primers and 0.97 ( R 2 = 0.62) for N2 primers.
Fig. 1: Replicate RNA extraction and analyses for SARS-CoV-2 RNA.
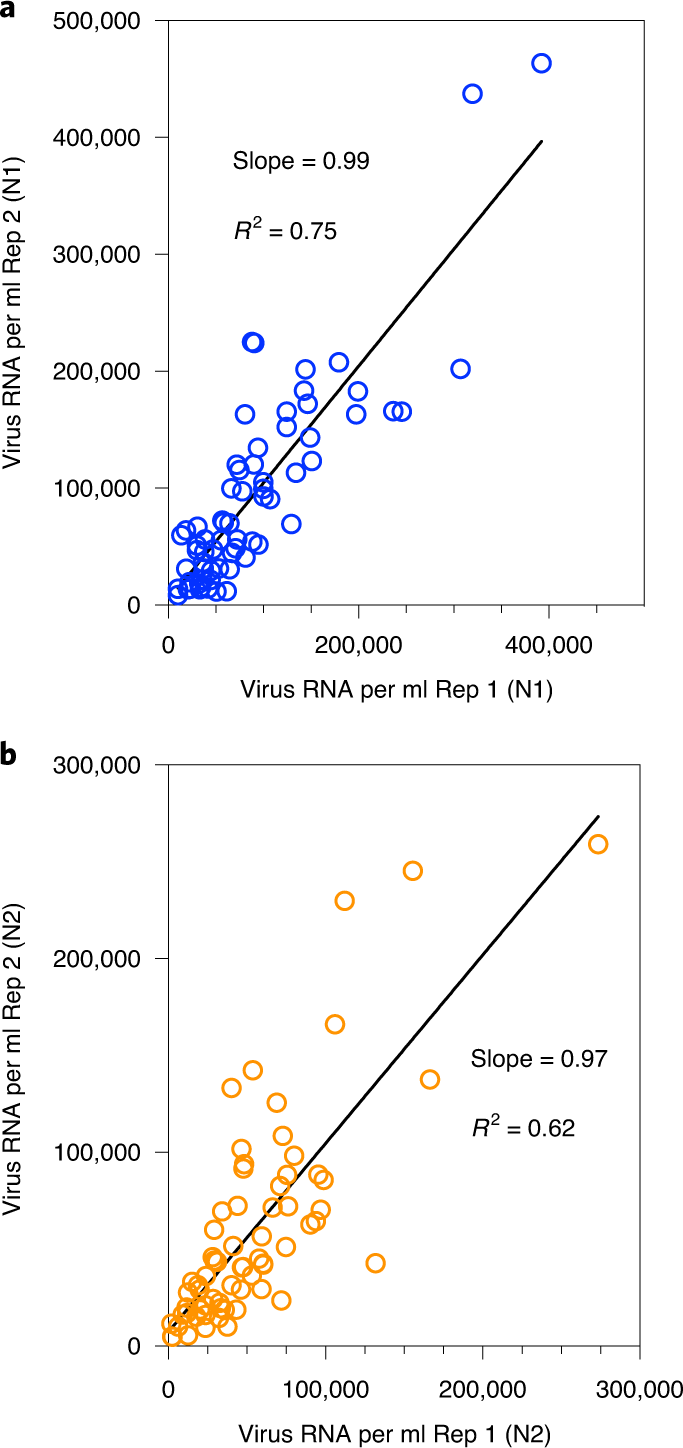
a , Comparison of SARS-CoV-2 RNA concentration between two replicates (Rep 1 and Rep 2) using the N1 primer set. b , Comparison of SARS-CoV-2 RNA concentration between two replicates using the N2 primer set.
All five measures traced the rise and fall of SARS-CoV-2 infections during the more than 10-week period studied (Fig. 2). However, the sludge results showed an increase during the first week (March 19–25, 2020) that was not observed in the reported testing or hospital admissions data. Applying a distributed lag measurement error time series model allowed an estimation of relationships between viral time series results and the reported testing and hospital admissions data. By modeling the epidemiological time series as a function of the sludge SARS-CoV-2 RNA data across multiple daily lags (posterior means ± 90% credible intervals), we found that the sludge results led the number of positive tests by date of specimen collection by 0–2 d, with a potential lag of 1 d (Fig. 3a,b); the percentage of positive tests by date of specimen collection by 0–2 d, with a potential lag of 1 d (Fig. 3c,d); hospital admissions by 1–4 d (Fig. 3e,f); and the number of positive tests by report date by 6–8 d (Fig. 3g,h). Performing the time series analysis with or without adjustment for testing volume did not result in differences in estimated lag times between sludge viral RNA results and number of positive tests (based on the above date of specimen collection results and date reported to the Connecticut State Department of Public Health) (Extended Data Fig. 1).
Media
Taxonomy
- Covid-19