When Extreme Rainfall Disrupts a Water Supply
Published on by Peter Urich, Managing Director at CLIMsystems Limited in Academic
Extreme rainfall in early March disrupted a water supply in Auckland, NZ.
For Watercare, who are responsible for treating and supplying the city’s reticulated water supply (and waste water treatment) the event is likely to stimulate some strategic thinking. With widespread rain and three ‘pulses’ of extreme but short duration rain in different parts of the city its services were stress tested.
One of the foci for extreme rainfall was in the Hunua-Wharekawa ranges located southeast of the city. This elevated area plays a critical role in the ever expanding footprint of water capture for the country’s primate city.
Water has always been a challenge for Auckland City. From the development of the first piped supply from a small crater lake in the Auckland Domain in 1869. Today water is sourced from the Waitakere Ranges to the west of the city, the Hunua-Wharekawa Ranges to the Southeast and the Waikato River (37 kms).

Location of Hunua-Wharekawa Ranges in Auckland City
The March 2017 Event
The six day rain event across the Auckland region had several distinctive ‘heavier’ spells. However this blog is only looking at the extreme roughly 24 hour event that took place in the Hunua-Wharekawa ranges. It was this event that triggered the risk of a water boiling notice being issued for areas of Auckland City that receive water from the Ardmore Treatment plant that receives its source water from the Hunua-Wharekawa ranges.
There were various statements issued such as NIWA’s Ben Noll’s comment that Hunua saw a 1 in 100-year rain event (Lawton, 2017) and Professor James Renwick’s comment in reference to recent rains in California and New Zealand: “...that's exactly the picture, you get long periods of severe drought and then when it starts to rain it really hammers down”.
The event in the Hunuas that lasted just over 24 hours started on Tuesday afternoon the 7th of March and extended through to Wednesday afternoon the 8th. For this analysis we have gathered various sources of data to compare this event with historical rainfall records and to explore potential future extreme events with climate change.
It is important to note that many rainfall records are collected using equipment that records rainfall on a 24 hour temporal scale i.e. once a day recording typically starting at midnight or 8am or 9am each day. As is exemplified in the case of the Hunua-Wharekawa extreme event the examination of typically recorded daily time step records would have missed the extreme nature of the event. It also points to the importance of sub-daily and even sub-hourly data for rainfall where extreme events are concerned.
Many of the rainfall stations in the Hunua-Wharekawa ranges area have been closed (Table 1) so we accessed rainfall data from a local citizen weather champion’s site. The total rainfall on the 7th of March was 89.7 mm. On the 8th of March the total was 185.7 mm so that the total over a roughly 24 hour period over two days reached 275.4 mm.
Note that the graph on the 8th of March (Figure 2) failed to display the total of 185.7 mm for the day owing to limitations of the display software package. Over the first 12 days of the month 498.5 mmm of rain fell in the vicinity of the Hunuas as recorded at the Young’s recording site with 454.4 mm of that falling over 5 days.
Table 1: Rainfall totals for days with rain at the Young’s recording site from 1st to 12th of March.

Table 2: Historical and current rainfall gauging sites in the vicinity of the Hunua-Wharekawa ranges area. Percent is the percent of complete records for the recording period of record. (Source: NIWA CliFlo database)
| Station# | Start date | End date | Percent | Name | Lat | Long |
| 2032 | 1-Feb-79 | 31-Jan-92 | 100 | Hunua Edl | -37.082 | 175.071 |
| 1962 | 1-May-62 | 9-Mar-17 | 80 | Auckland Aero | -37.00813 | 174.78873 |
| 41228 | 1-Aug-13 | 9-Mar-17 | 100 | Auckland Aero Backup Aws | -37.00884 | 174.80713 |
| 1965 | 1-Jun-44 | 30-Nov-16 | 100 | Auckland, Ardmore | -37.03402 | 174.96394 |
| 1500 | 1-Nov-35 | 31-Mar-05 | 100 | Manukau Heads 2 | -37.05276 | 174.54436 |
| 2034 | 15-Feb-90 | 30-Jun-03 | 100 | Hunua, Cowan Road | -37.092 | 175.069 |
| 2033 | 1-Jan-89 | 31-Dec-01 | 100 | Gillespie Road | -37.093 | 175.026 |
| 2032 | 1-Feb-79 | 31-Jan-92 | 100 | Hunua Edl | -37.082 | 175.071 |
| 2047 | 31-Mar-65 | 31-Jul-84 | 90 | Rose | -37.017 | 175.15 |
| 2035 | 31-Dec-64 | 31-Jul-84 | 90 | Moumoukai Office | -37.083 | 175.15 |
| 2031 | 31-Oct-62 | 31-Jul-84 | 80 | Hunua Nursery | -37.083 | 175.083 |
| 2045 | 30-Jun-56 | 31-Jul-84 | 60 | Cosseys No 1 | -37.05 | 175.1 |
| 2049 | 30-Sep-49 | 31-Jul-84 | 50 | Auckland,Kohukohunui | -37.033 | 175.217 |
| 2050 | 30-Jun-56 | 31-Dec-76 | 50 | Konini | -37.067 | 175.2 |
| 2036 | 30-Jun-56 | 31-Jan-74 | 50 | Trig 1949 | -37.017 | 175.1 |
Only two of the 15 historic rainfall gauging stations in the region of the Hunuas are still in operation of those listed in NIWA’s CliFlo database. For the 7th and 8th of March those two stations recorded only 30 mm on the 7th and 20mm of rainfall on the 8th of March. Clearly the extreme aspects of the regional rainfall event were highly localised.
We looked across the 14 closed sites and found that the highest daily rainfall total was on the 2nd of March 1967 and was recorded across three sites near the Hunuas: Rose: 203.5 mm; Cosseys No 1 210.8 mm; and, Hunua Nursery 190.5 mm. There was definitely a spate of recorded extremes for the Hunua area in the late 1960s and 1970s as derived from the 14 closed NIWA CliFlo site data records.
This begs the question...are we within a Pacific oscillation cycle as identified by Salinger, Renwick and Mullan in their 2001 paper on Interdecadal Pacific Oscillation and South Pacific Climate (Salinger et al., 2001) but with the added veneer of climate change?
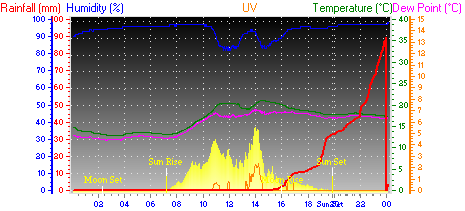
Figure 1: Rainfall profile for Tuesday 7th of March from Youngs Weather Site (Gelling road in the Hunua/Ararimu area in the Hunua ranges).
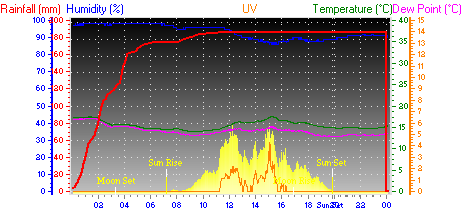
Figure 2: Rainfall profile for Wednesday 8th of March from Youngs Weather Site (Gelling Road in the Hunua/Ararimu area in the Hunua ranges).
The peak hourly rainfall intensity over the roughly 24 hour event was 49.8 mm from 12:19 pm to 1:19 pm on the 8th of March. Based on the following historical extreme event data from NIWA for the Auckland region the hourly extreme is approximately a 1 in 30 year event while the slightly greater than 24 hour event is indeed very close to the 1 in 100 year event intensity.
Table 3: Extreme rainfall amounts from 10 minute to 72 hour events and their return period from 1.58 years to 100 years. AEP=Annual Exceedance Probability that is the percentage probability of a particular storm event being exceeded in any one year. Derived and processed from the NIWA High Intensity Rainfall System V3 (https://hirds.niwa.co.nz/)
| ARI (y) | AEP | 10m | 20m | 30m | 60m | 2h | 6h | 12h | 24h | 48h | 72h |
| 1.58 | 0.633 | 9.1 | 13.1 | 16.1 | 23.1 | 31.3 | 50.6 | 68.4 | 92.6 | 110.9 | 123.2 |
| 2 | 0.500 | 9.9 | 14.2 | 17.5 | 25.1 | 34 | 54.8 | 74.2 | 100.3 | 120.1 | 133.4 |
| 5 | 0.200 | 12.8 | 18.3 | 22.6 | 32.4 | 43.7 | 70.3 | 94.9 | 128 | 153.3 | 170.3 |
| 10 | 0.100 | 15.1 | 21.7 | 26.7 | 38.3 | 51.6 | 82.9 | 111.7 | 150.5 | 180.2 | 200.2 |
| 20 | 0.050 | 17.8 | 25.5 | 31.4 | 45 | 60.6 | 97 | 130.6 | 175.8 | 210.4 | 233.7 |
| 30 | 0.033 | 19.5 | 27.9 | 34.5 | 49.4 | 66.4 | 106.3 | 142.9 | 192.2 | 230 | 255.5 |
| 40 | 0.025 | 20.8 | 29.8 | 36.8 | 52.8 | 70.9 | 113.3 | 152.3 | 204.7 | 245 | 272.1 |
| 50 | 0.020 | 21.9 | 31.4 | 38.7 | 55.5 | 74.6 | 119 | 159.9 | 214.9 | 257.2 | 285.7 |
| 60 | 0.017 | 22.8 | 32.7 | 40.4 | 57.8 | 77.7 | 123.9 | 166.5 | 223.5 | 267.6 | 297.2 |
| 80 | 0.012 | 24.4 | 34.9 | 43.1 | 61.7 | 82.8 | 132.1 | 177.3 | 237.9 | 284.8 | 316.4 |
| 100 | 0.010 | 25.6 | 36.7 | 45.3 | 64.9 | 87.1 | 138.7 | 186.1 | 249.7 | 298.9 | 332 |
Climate Change
The return period for the recent roughly 24 hour event in the Hunua-Wharekawa ranges will likely shorten as temperatures increase with climate change. With a one degree rise in mean temperature the 60 minute rainfall intensity return period could shorten to a 1 in 20 year event and with a two degree increase in mean temperature become a roughly one in 15 year event and with a three degree increase a 1 in 10 year event or a ten percent chance of it occurring in any year.
Similarly the 1 in 100 year event of around 275 mm would remain about a 1 in 100 year event with a one degree change in mean temperature but shorten to a 1 in 80 year event and 1 in 60 year event with a two and three degree increase in mean temperature, respectively. Note that the intensity of the 1 in 100 year event with a two and three degree rise in mean temperatures could increase to approximately 290 and 310 mm, respectively.
Table 4: Projected local rainfall intensity changes with a one degree Celsius increase in global temperature.
| ARI (y) | AEP | 10m | 20m | 30m | 60m | 2h | 6h | 12h | 24h | 48h | 72h |
| 1.58 | 0.633 | 9.8 | 14.1 | 17.3 | 24.6 | 33.2 | 53.3 | 71.7 | 96.6 | 115.1 | 127.5 |
| 2 | 0.5 | 10.7 | 15.3 | 18.8 | 26.8 | 36.1 | 57.7 | 77.8 | 104.6 | 124.7 | 138.1 |
| 5 | 0.2 | 13.8 | 19.7 | 24.3 | 34.7 | 46.6 | 74.6 | 100.4 | 134.9 | 161 | 178.5 |
| 10 | 0.1 | 16.3 | 23.4 | 28.7 | 41.1 | 55.3 | 88.5 | 119 | 160 | 191.2 | 212 |
| 20 | 0.05 | 19.2 | 27.5 | 33.8 | 48.5 | 65.2 | 104.2 | 140.1 | 188.5 | 225.3 | 250.1 |
| 30 | 0.033 | 21.1 | 30.1 | 37.3 | 53.4 | 71.7 | 114.8 | 154.3 | 207.6 | 247.9 | 275.2 |
| 40 | 0.025 | 22.5 | 32.2 | 39.7 | 57 | 76.6 | 122.4 | 164.5 | 221.1 | 264.4 | 293.5 |
| 50 | 0.02 | 23.7 | 33.9 | 41.8 | 59.9 | 80.6 | 128.5 | 172.7 | 232.1 | 277.8 | 308.6 |
| 60 | 0.017 | 24.6 | 35.3 | 43.6 | 62.4 | 83.9 | 133.8 | 179.8 | 241.4 | 289 | 321 |
| 80 | 0.012 | 26.4 | 37.7 | 46.5 | 66.6 | 89.4 | 142.7 | 191.5 | 256.9 | 307.6 | 341.7 |
| 100 | 0.01 | 27.6 | 39.6 | 48.9 | 70.1 | 94.1 | 149.8 | 201 | 269.7 | 322.8 | 358.6 |
Table 5: Projected local rainfall intensity changes with a two degree Celsius increase in global temperature.
| ARI (y) | AEP | 10m | 20m | 30m | 60m | 2h | 6h | 12h | 24h | 48h | 72h |
| 1.58 | 0.633 | 10.6 | 15.1 | 18.4 | 26.2 | 35.2 | 56 | 75 | 100.6 | 119.3 | 131.8 |
| 2 | 0.5 | 11.5 | 16.4 | 20 | 28.5 | 38.2 | 60.6 | 81.3 | 108.9 | 129.2 | 142.7 |
| 5 | 0.2 | 14.8 | 21.1 | 25.9 | 37 | 49.6 | 78.9 | 105.9 | 141.8 | 168.6 | 186.6 |
| 10 | 0.1 | 17.5 | 25.1 | 30.8 | 44 | 59 | 94.2 | 126.2 | 169.5 | 202.2 | 223.8 |
| 20 | 0.05 | 20.6 | 29.6 | 36.3 | 51.9 | 69.8 | 111.4 | 149.7 | 201.1 | 240.3 | 266.4 |
| 30 | 0.033 | 22.6 | 32.4 | 40 | 57.3 | 77 | 123.3 | 165.8 | 223 | 265.9 | 294.8 |
| 40 | 0.025 | 24.1 | 34.6 | 42.7 | 61.2 | 82.2 | 131.4 | 176.7 | 237.5 | 283.7 | 314.8 |
| 50 | 0.02 | 25.4 | 36.4 | 44.9 | 64.4 | 86.5 | 138 | 185.5 | 249.3 | 298.4 | 331.4 |
| 60 | 0.017 | 26.4 | 37.9 | 46.9 | 67 | 90.1 | 143.7 | 193.1 | 259.3 | 310.4 | 344.8 |
| 80 | 0.012 | 28.3 | 40.5 | 50 | 71.6 | 96 | 153.2 | 205.7 | 276 | 330.4 | 367 |
| 100 | 0.01 | 29.7 | 42.6 | 52.5 | 75.3 | 101 | 160.9 | 215.9 | 289.7 | 346.7 | 385.1 |
Table 6: Projected local rainfall intensity changes with a three degree Celsius increase in global temperature.
| ARI (y) | AEP | 10m | 20m | 30m | 60m | 2h | 6h | 12h | 24h | 48h | 72h |
| 1.58 | 0.633 | 11.3 | 16.1 | 19.6 | 27.7 | 37.1 | 58.6 | 78.2 | 104.5 | 123.5 | 136.1 |
| 2 | 0.5 | 12.3 | 17.5 | 21.3 | 30.1 | 40.3 | 63.5 | 84.9 | 113.2 | 133.8 | 147.4 |
| 5 | 0.2 | 15.9 | 22.5 | 27.6 | 39.3 | 52.5 | 83.2 | 111.4 | 148.7 | 176.3 | 194.8 |
| 10 | 0.1 | 18.7 | 26.8 | 32.8 | 46.8 | 62.7 | 99.8 | 133.5 | 178.9 | 213.2 | 235.6 |
| 20 | 0.05 | 22.1 | 31.6 | 38.7 | 55.4 | 74.4 | 118.5 | 159.2 | 213.8 | 255.2 | 282.8 |
| 30 | 0.033 | 24.2 | 34.6 | 42.8 | 61.3 | 82.3 | 131.8 | 177.2 | 238.3 | 283.8 | 314.5 |
| 40 | 0.025 | 25.8 | 37 | 45.6 | 65.5 | 87.9 | 140.5 | 188.9 | 253.8 | 303.1 | 336.2 |
| 50 | 0.02 | 27.2 | 38.9 | 48 | 68.8 | 92.5 | 147.6 | 198.3 | 266.5 | 318.9 | 354.3 |
| 60 | 0.017 | 28.3 | 40.5 | 50.1 | 71.7 | 96.3 | 153.6 | 206.5 | 277.1 | 331.8 | 368.5 |
| 80 | 0.012 | 30.3 | 43.3 | 53.4 | 76.5 | 102.7 | 163.8 | 219.9 | 295 | 353.2 | 392.3 |
| 100 | 0.01 | 31.7 | 45.5 | 56.2 | 80.5 | 108 | 172 | 230.8 | 309.6 | 370.6 | 411.7 |
The next extreme rainfall event in the Hunuas may occur at any time. The wake-up call is ringing. If it is answered then the following should be considered:
- What data is available and not just station data but also satellite rainfall data that is carefully post-processed. Most datasets that are made publicly available have issues that need to be carefully considered by people with expert knowledge on model assessment.
- A holistic view or a systems thinking approach is required. Such an approach can expose weaknesses in a system that will not become apparent without a multifaceted approach that may include, policy, practice, technology and methodology.
- Who should lead or facilitate this complex task? To bring all these things together to create knowledge requires people with boundary crossing experience.
- Where are the data gaps (e.g. weather station closures) and how can this issue be overcome in a cost effective and timely manner? There is definitely an avenue here for citizen science based projects that could help plug the data gaps.
- What are the governance arrangements within the lead agencies that allow climate change and other factors to be seamlessly considered? A review of all corporate documents to identify the extent of climate change mainstreaming is warranted – and where there are gaps the development of a policy or corporate standard should be implemented to ensure a consistent and robust approach to informed-decision making.
- What is an adequate failure threshold? Surely the water treatment facilities for a large urban area should incorporate planning for an event that exceeds a 1 to 100 year event (with climate change perturbations).
- What climate change elements should be considered – for example what climate change models, what downscaling, what climate scenario, what times frames etc?
Authors: Peter Urich, Yinpeng Li and
Read full article at: Clim Systems
Attached link
http://climsystems.com/blog/post/when-extreme-rainfall-disrupts-a-water-supply-the-case-of-auckland-city-new-zealandMedia
Taxonomy
- Drinking Water Treatment
- Disaster Prevention
- Integrated Urban Water Management
- Stormwater Management
- Climate Change
- Stormwater
- Water Supply
- Integrated Infrastructure
- Design & Construction
- Storm Water Management
- Distribution Network Management
- Disaster Preparedness
- Disaster Management
1 Comment
-
Hello All; Residing here on the East Coast of the United States of America, we also get some very high tidal surges and peak flow riparian events. To offset disruption of our POTWs, we have adapted "bypass flow retention systems" which collect the overflow during storm events and restricts this excess fluid volume from the treatment mainstream. Of course, the volume data is different in every location and calculations, projections, and models need to be integrated to compensate for all possible system volume overflow scenarios. The excesses are incorporated back into the mainstream slowly, so as not to interrupt the processes or the regulated flow. This course of action has been proven very successful here at Baltimore over the last several decades ! I hope this may help you in abating a very serious water process problem in New Zealand.