Excessive Groundwater Pumping Causes San Joaquin Valley to Sink
Published on by Water Network Research, Official research team of The Water Network in Academic
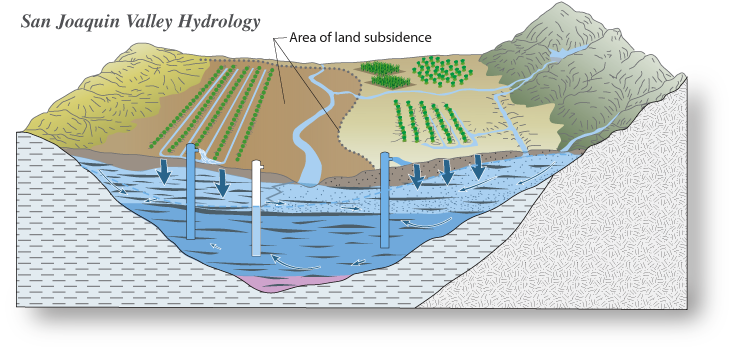
Since the 1920s, excessive pumping of groundwater at thousands of wells in California’s San Joaquin Valley has caused land in sections of the valley to subside, or sink, by as much as 28 feet (8.5 meters).
NASA illustrates how.
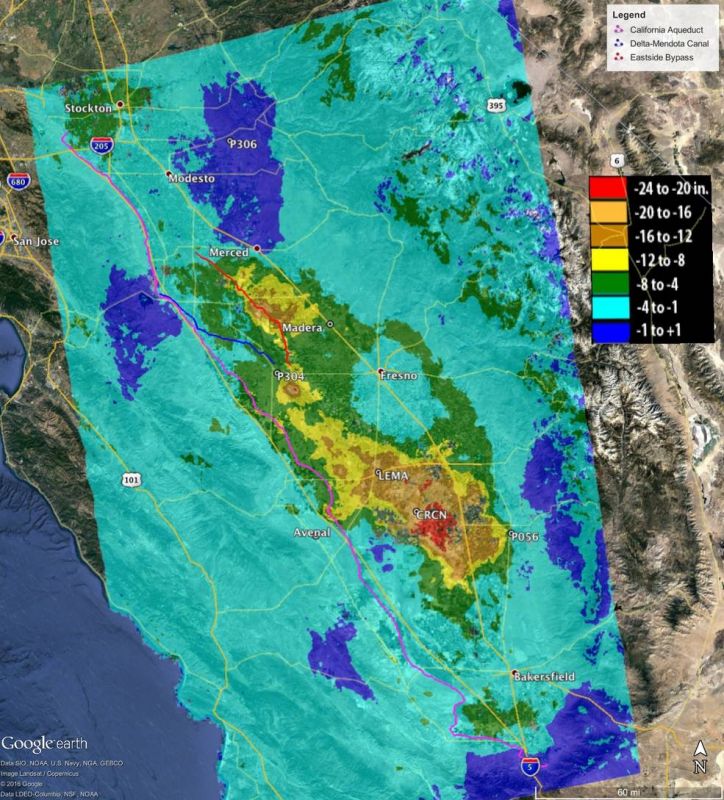
Total subsidence in California’s San Joaquin Valley between May 7, 2015 and Sept. 10, 2016, as measured by ESA’s Sentinel-1A and processed at JPL. Two large subsidence bowls are evident, centered on Corcoran and southeast of El Nido, with a small, new feature between them, near Tranquility. Credits: European Space Agency/NASA-JPL/Caltech/Google Earth
This subsidence is exacerbated during droughts, when farmers rely heavily on groundwater to sustain one of the most productive agricultural regions in the nation.
Long-term subsidence is a serious and challenging concern for California’s water managers, putting state and federal aqueducts, levees, bridges and roads at risk of damage. Already, land subsidence has damaged thousands of public and private groundwater wells throughout the San Joaquin Valley.
Furthermore, the subsidence can permanently reduce the storage capacity of underground aquifers, threatening future water supplies. It’s also expensive. While there is no comprehensive estimate of damage costs associated with subsidence, state and federal water agencies have spent an estimated $100 million on subsidence-related repairs since the 1960s.
To determine the extent to which additional groundwater pumping associated with California’s current historic drought, which began in 2012, has affected land subsidence in the Central Valley, California’s Department of Water Resources (DWR) commissioned NASA’s Jet Propulsion Laboratory, Pasadena, California, to use its expertise in collecting and analyzing airborne and satellite radar data.
An initial report of the JPL findings (Aug. 2015) analyzed radar data from several different sensors between 2006 and early 2015. Due to the continuing drought, DWR subsequently commissioned JPL to collect and analyze new radar images from 2015 and 2016 to update DWR on the land subsidence.
How the study was done
To obtain the subsidence measurements, JPL scientists compared multiple satellite and airborne interferometric synthetic aperture radar (InSAR) images of Earth's surface acquired as early as 2006 to produce maps showing how subsidence varies over space and time. InSAR is routinely used to produce maps of surface deformation with approximately half-inch-level (centimeter-level) accuracy.
The subsidence maps in the new report were created by analyzing satellite data from the European Space Agency’s Sentinel-1A satellite from March 2015 to Sept. 2016, and from NASA’s airborne Uninhabited Aerial Vehicle Synthetic Aperture Radar (UAVSAR) from March 2015 to June 2016. The new data complement the data used in the previous report from Japan's PALSAR (2006 to 2010), Canada's Radarsat-2 (May 2014 to Jan. 2015) and UAVSAR (July 2013 to March 2015).
How subsidence affects key California water supply routes
The high-resolution airborne UAVSAR radar mapping was focused on the California Aqueduct, the main artery of the State Water Project, which supplies 25 million Californians and nearly a million acres of farmland. The aqueduct is a system of canals, pipelines and tunnels that carries water 444 miles (715 kilometers) from the Sierra Nevada and Northern/Central California valleys to Southern California.
The JPL report shows that localized subsidence directly impacting the aqueduct is ongoing, with maximum subsidence of the structure reaching 25 inches (64 centimeters) near Avenal in Kings County. As a result of subsidence in this area since the initial aqueduct construction, the aqueduct there can now carry a reduced flow of only 6,650 cubic feet (188 cubic meters) per second -- 20 percent less than its design capacity of 8,350 cubic feet per second (236 cubic meters per second). Water project operators must reduce flows in the sections that have sunk to avoid overtopping the concrete banks of the aqueduct.
DWR, which operates the State Water Project, is analyzing whether the subsidence-created dip in the California Aqueduct will affect deliveries to water districts in Kern County and Southern California. If the State Water Project allocation is 85 percent or greater, delivery may be impaired this year due to cumulative subsidence impacts in the Avenal-Kettleman City area.
The new NASA analysis also found subsidence of up to 22 inches (56 centimeters) along the Delta-Mendota Canal, a major artery of the Central Valley Project (CVP), operated by the U.S. Bureau of Reclamation. The CVP supplies water to approximately three million acres of farmland and more than two million Californians.
The upcoming NASA and ISRO (Indian Space Research Organisation) radar mission, NISAR, will systematically collect data over California and the world and will be ideal for measuring and tracking changes to the land subsidence associated with groundwater pumping, as well as uplift associated with natural and assisted groundwater recharge.
Read more at: Sierra Sun Times
Media
Taxonomy
- Pumping System Design
- Groundwater
- GIS
- Geospatial Information Systems
- Groundwater Mapping
- GIS Spatial Analysis
- GIS & Remote Sensing