Water Cycle Diagrams are Giving Us a False Sense of Water Security
Published on by Water Network Research, Official research team of The Water Network in Academic
New study finds textbook depictions need to be updated to show human impact - reports Todd Hollingshead from BYU News.

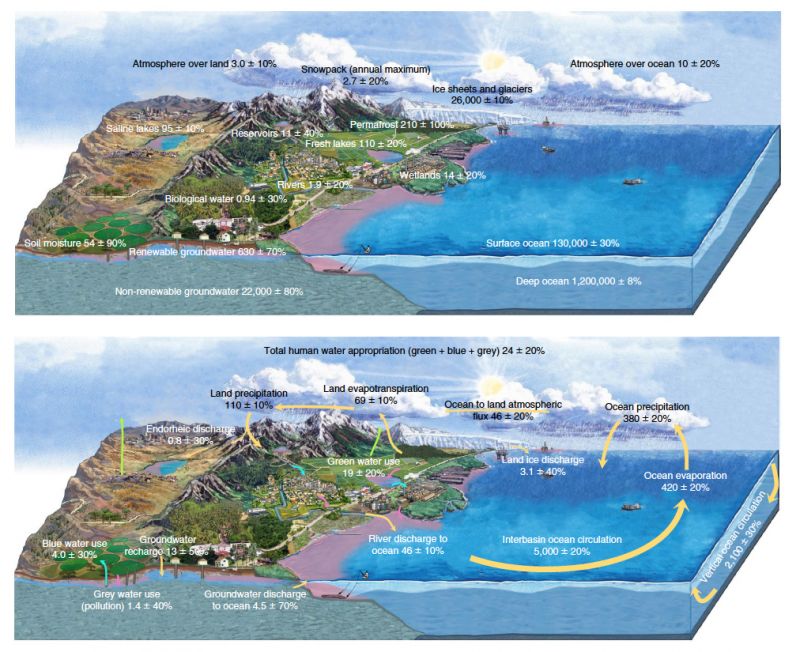
The bottom image depicts the human impact on the water cycle. (Image found on BYU)
Diagrams of the earth’s water cycle used in education and research throughout the world are in urgent need of updating to show the effects of human interference, according to new analysis by a BYU-led team of international hydrology experts.
Leaving humans out of the picture, the researchers argue, contributes to a basic lack of awareness of how humans relate to water on Earth and promotes a false sense of security of how much water is actually available for human use.
“You can’t understand water in the 21st century without including humans,” said BYU professor and study lead author Ben Abbott. “Better drawings of the water cycle won’t solve the global water crisis on their own, but they could improve awareness of how local water use and climate change have global consequences.”
Abbott, his students and colleagues in six countries examined over 450 water cycle diagrams from textbooks, scientific literature and online sources for the study, published today in Nature Geoscience. They discovered that the diagrams misrepresented major parts of the water cycle; only 15 percent depicted human interaction and only 2 percent made any attempt to connect the cycle to climate change or water pollution.
While critiquing diagrams may sound nitpicky, researchers point out that the images inform general understanding of how water works in the world, and misunderstanding the water cycle can lead to the mismanagement of essential water resources. Already, roughly 1.8 million people die from water pollution annually, while others have lost their livelihood or have been forced to desert hometowns.
Researchers also found current diagrams largely depict only verdant landscapes, with mild climates and abundant freshwater — usually with only a single river basin. In addition to pointing out the flaws, the team has created a new set of diagrams to promote better understanding of how the water cycle works in the 21st century, which include elements such as meltwater from glaciers, flood damage caused by land use changes and sea level rises.
“For many people, the diagram of the global water cycle is the point of entry into thinking about key scientific concepts such as conservation of mass and human dependence and influence on Earth’s great cycles,” Abbott said. “Unfortunately, our drawings of the water cycle are stuck in the 17th century.”
Researchers, led by Abbott and four BYU students, also compiled the latest estimates of water on Earth from over 80 global water studies, which show how extensive the human water footprint has become. They found that humans now use more than half of the water that runs through all the world’s rivers, 24,000 cubic kilometers each year. More than half of the global water footprint is from raising livestock.
The study was carried out by a large team of experts from BYU, Michigan State University and the University of Birmingham in the UK, along with other partners in the U.S., France, Canada, Switzerland and Sweden.
“By leaving out climate change, human consumption, and changes in land use we are, in effect, creating large gaps in understanding and perception among the public and also among some scientists,” said study coauthor David Hannah, UNESCO Chair in Water Sciences at the University of Birmingham.
Reference:
Benjamin W. Abbott et al, "Human domination of the global water cycle absent from depictions and perceptions", Nature Geoscience, June 2019, DOI: 10.1038/s41561-019-0374-y
Source: BYU News
Cover illustration by AIRS on Flickr
Media
Taxonomy
- Crisis
- Ecosystem Management
- GIS
- Water Cycle
- Ecosystem Management
- Pollution
- Climate Change
- Climate Change Adaptation
- Hydrology Cycle