Water Infographic: Alarming Statistics About Wasted Water in Our Communities
Published on by Yoshimi Yoshida, Environmental Consultant in Academic
Water Infographic: Alarming Statistics About Wasted Water in Our Communities
AdOptions ByChris Maxwell-Gaines PostedJuly 6, 2012 InSustainable Stormwater Management1
This infographic has wrong statistics!!
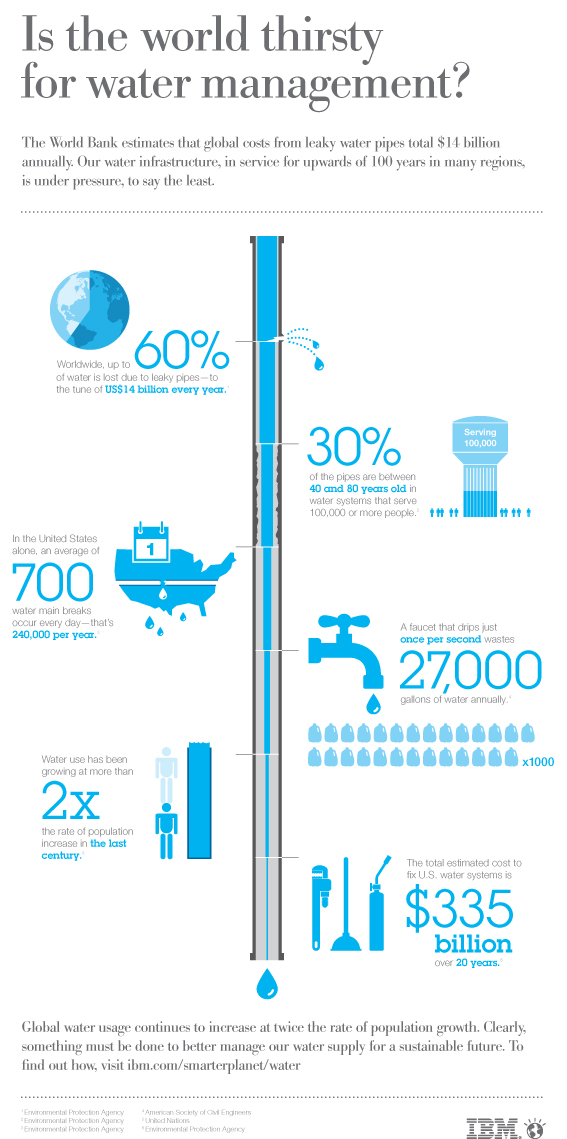
IBM created a water infographic to highlight some alarming statistics about how much water is wasted due to leaks in our water distribution infrastructure. A third of the water infrastructure in the US is 40 to 80 years old. Therefore, replacing this old infrastructure and repairing leaks is estimated to cost $335 billion over the next 20 years. In terms of water waste, not only do the leaky faucets in our homes waste a lot of water, but there is an average of 700 water main breaks each day across the US which wastes a tremendous amount of water. Thesepipe leaks are also exasperated by drought conditions, currently affecting a big part of the US.
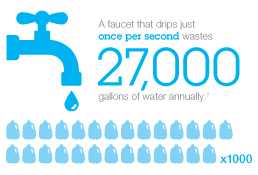
Update: The statistics in this infographic may be suspect. Michael Campana (@WaterWired) researched it a bit in thispostand found that dripping faucets don't waste 27,000 gallons per year, but only 2,700 gallons per year.
SO WHAT CAN I DO?
While the issues represented in the infographic have to be solved on a municipal scale by municipalities and water providers, there are some action steps that you, the homeowner, can take to do your part.
We can all reduce the amount of water we use on a daily basis. During the summer months, many cities report that theirwater customers use more water for outdoor irrigationthan inside the house. Therefore, while conserving water indoors is helpful, the larger bang-for-the-buck conservation gains happen outdoors.
Here are a few suggestions to tame your outdoor water usage:
- Reduce the amount of landscaping that requires intensive watering such as turf grass areas and replace with drought tolerant plants or xeriscaped areas
- Find ways tomake your underground irrigation system more efficientby fixing leaks and upgrading system components
- Invest in supplying auxiliary water to your landscaping withrainwater harvesting systemsandgraywater reuse systems
Some of these suggestions may not provide immediate payback but it is better to reduce your water use now and be prepared for higher water rates that will certainly come in the future. The amount of investment that it will take to fix our water infrastructure will have to come from somewhere, and that somewhere will most likely be from the water end users, with urban residential water consumers seeing the brunt of the water rate increases.
Do you have other suggestions for conserving water in your lawn and landscape?

Click here to download original infographic
Get My Blog Updates by Email
If water is the next oil, then you had better stay informed. My blog posts will do just that.
100% Privacy Guaranteed
Tags:Water Conservation,Water InfrastructureChris Maxwell-Gaines Civil engineer and urban planner focused on creating impacting and sustainable projects by identifying all of the hidden water conservation opportunities available. Particularly interested in working within the realms of sustainable site planning, conservation subdivision design, integrated water management and planning, and low impact development practices.
AdsbymacshopAdOptions RECOMMENDED POSTS
CONNECT WITH ME Get Blog Updates by Email
Email marketing powered by MailChimp
811 Subscribers
MY FEED : CLICK HERE FOR MOREAdsbymacshopAdOptions ABOUT THE AUTHOR
This is the blog for Innovative Water Solutions. We are a company that is passionate about water conservation and providing solutions for our clients that save them water.
You can find out more about the authorhere.
CATEGORIES
- Events(7)
- Graywater Reuse(3)
- Green Building(1)
- Irrigation Systems(1)
- Rainwater Harvesting(11)
- Sustainable Stormwater Management(3)
- Water Conservation(9)
- Water News Summary(10)
- Water Reuse(1)
- Water Supply(5)
CONTACT ME SEND MESSAGE  ©2004-2015 Innovative Water Solutions, LLC - All Rights Reserved

14 8
8 8
8 3
3


AdsbymacshopAdOptions


Original Graph by IBM
http://www.ibm.com/smarterplanet/global/files/us__en_us__water__water_infographic_031512.pdf
Taxonomy
- Leakage
- Leakage Reduction


