Achieving 70x Cooling Tower Blowdown Volume Reduction (Case Study)
Published on by Water Network Research, Official research team of The Water Network in Case Studies
Key Takeaways:
- Recent RO improvements enable extreme recoveries of up to 99% for treating cooling tower blowdown (CTBD) for minimal liquid discharge (MLD) while reducing capacities for zero liquid discharge (ZLD) systems.
- Costs and complexity increase with each added process step to boost recovery. The costs and processes are covered herein.
- Know your brine disposal costs to determine where to stop in the treatment process. Each incremental process can achieve greater volume reduction and recovery but only take the next step when the treatment cost is less than the disposal cost.
- BrineRefine chemical softening systems enable higher RO recoveries and reduce scaling/fouling.
- Ultra-high-pressure spiral wound membrane systems can achieve brine concentrations near that of evaporators, 130,000 mg/L total dissolved solids (TDS), so long as scaling and fouling are controlled.
Image source: PXhere, labeled for reuse
Background
Cooling towers are used by industrial plants to reject waste heat to the atmosphere. Evaporation of the water to remove the plant’s process heat results in the concentration of ions and metals in the cooling water. A portion of the cooling water is blown down after a number of cycles of concentration before the ions and metals reach their scaling limits. This blowdown requires management. Makeup water, typically from a freshwater source, replaces the lost water from the blowdown as well as from evaporation and drift.
Options for managing cooling tower blowdown (CTBD) requires management with options consisting of:
- Direct discharge to nearby surface water if regulations permit;
- Storage and volume reduction in an evaporation pond if climatic conditions are favorable;
- Disposal via injection wells if located near the site;
- Discharge to a local wastewater treatment facility if they accept; or
- Treatment for discharge or reuse.
The focus of this article is on the last option: CTBD treatment.
Cooling Tower Blowdown Treatment
To treat CTBD, a water treatment practitioner would need to understand some key project information:
- CTBD water chemistry and its scaling potential. Our article on RO & Evaporator Scale Control discusses how scale forms, its implication on water treatment systems, and how to avoid scaling. Alternatively, contact Saltworks with your chemistry and we can help you.
- The required water quality for the treated water for its intended final use, whether it is reused in the plant or discharged, will need to be considered. Any water treatment system will need to meet this water quality criterion.
- What to do with the brine? CTBD consists of inorganic constituents and any industrial desalination technology to treat the water will produce a concentrated brine. Our article How to Manage Brine Disposal & Treatment describes several options for managing this brine.
Combining the above information will inform the appropriate level of treatment, which could be a relatively simple pre-filtration and high recovery membrane system or a more advanced full treatment train of membrane and thermal systems to achieve minimal liquid discharge (MLD) or zero liquid discharge (ZLD). The total cost of treatment compared to other available means to manage the brine will determine how extensive a treatment process is required, as demonstrated in the following CTBD treatment case study.
Pilot Case Study
A North American power plant was sending their CTBD to evaporation ponds. However, the ponds were reaching capacity and offsite disposal was an expensive option. The power plant sought a treatment option to reduce offsite disposal volumes in order, to lower costs. Water chemistry is summarized in Table 1. The treated water needed to meet utility water reuse requirements required TDS < 500 mg/L.
Table 1: Power Plant Raw Water Chemistry and at Each Successive Recovery Increase 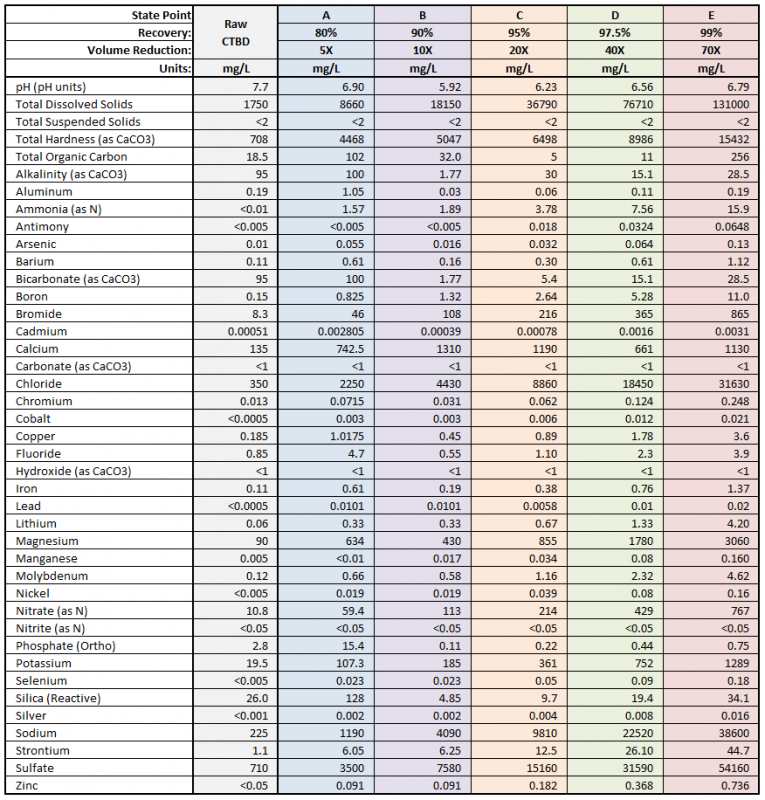
The water chemistry, with a TDS of 1,750 mg/L, is suitable for treatment by reverse osmosis (RO). For lowest cost, it is beneficial to achieve the highest RO recovery possible to minimize more expensive further brine volume reduction. An overview of RO and techniques to achieve maximum recovery are discussed in Reverse Osmosis Brine Treatment: Tech Advancements to Minimize Volume & Cost. 80% recovery is achievable with this primary RO, reducing CTBD volume by a factor of 5.
After primary RO, other technologies can further reduce volume and increase recovery by 10x (90%), 20x (95%), 40x (97.5%), and 70x (99%). These technologies are further described in the articles Modern Chemical Softening to Maximize RO Recovery and Applying Ultra-High Pressure Reverse Osmosis in Brine Management. The incremental process steps and costs required to achieve each are explored below. Volume reduction factors are presented as the primary metric, nothing that small recovery changes can be misleading. For example, boosting recovery from 95% to 97.5% may seem like gaining “only 2.5%”; however, this gain represents halving brine volume. This means 50% fewer trucks sent to disposal or a 50% smaller evaporation pond or a 50% smaller downstream evaporator. The savings to a project or operator can be enormous.
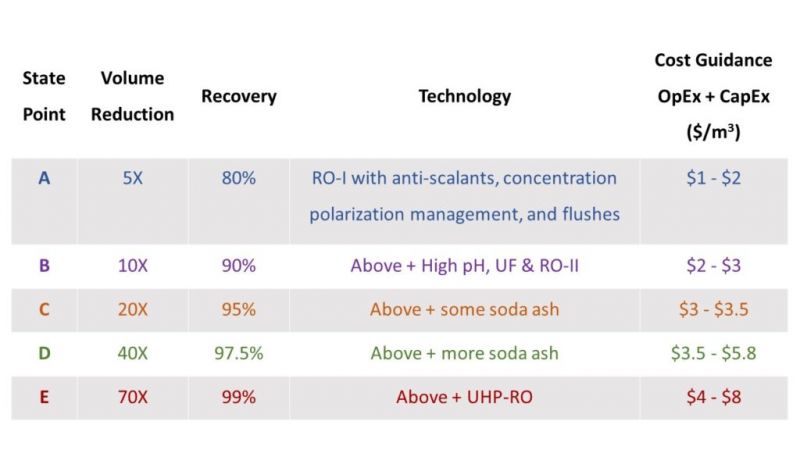
A flexible pilot plant was used to test the incremental CTBD volume reduction for the power plant. Figure 1 shows a simplified process flow diagram showing the water treatment plant’s process units. Table 2 shows each recovery stage (volume reduction), the technology to achieve it, and the cost guidance. The water chemistry emerging from each step is also included in Table 1.
Figure 1: Process Flow Diagram (PFD) showing Successive Recovery Additions
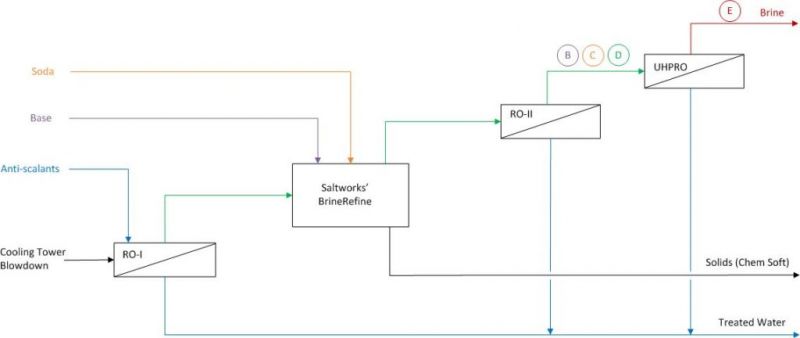
Table 2: Cooling Tower Blow Down Successive Recovery Increases
Although each step can be viewed as a unit operation, it should be treated as part of an integrated plant with a unified and integrated process controls. This is recommended for the following critical reasons:
- As feedwater chemistry and flow rates change upstream, an integrated plant can better react and adjust each unit operation accordingly.
- Enabling performance monitoring algorithms to be applied. This is done at both the plant and unit operation level, whereby upstream and downstream systems can communicate their performance and status to one another. Adjustments can then be made to achieve “best system efficiency.” Unified dashboard is included to assist plant operators and owners in monitoring performance.
- Coordinate all process control design methods, control system design components, and programming style and documentation for both capital cost and operational cost efficiency (e.g. spares and maintenance).
Brine concentration and composition changes with each incremental step in recovery improvement, shown in Table 1. It is possible to vary the quantity of soda ash (sodium bicarbonate) dosing to achieve the desired recovery: if higher recovery is desired then more soda ash can be added; if lower recovery is sufficient then less soda ash is needed. Regardless, it is advisable to stay below 80% calcium sulfate saturation in the brine to prevent irreversible scaling. Soda ash chemical cost can be one of the higher operational cost inputs into a high recovery plant; therefore, it should be controlled carefully. Saltworks has technology to help with this.
Economic Guidance
Readers are offered the following reminders and guidance when considering brine treatment economics:
- Sum the costs of chemical treatment and secondary RO, since the secondary RO would require chemical treatment to operate. For example, the net cost of a secondary RO may be $8/m3 ($4/m3 chemical treatment + $4/m3 RO).
- Thermal system costs are typically more than $20/m3, so although the advanced membrane brine system costs may seem high to traditional potable water RO practitioners, these costs are still much lower than thermal brine concentration methods.
- Know where to stop: For example, if a brine disposal outlet is available for $5/m3, a primary RO system may offer economic advantages for concentrating brine but a secondary RO may not.
- Capacity matters: For smaller capacity plants, adding unit operations can add process and operational complexities. For example, if the brine flow rate from the primary RO is 100 m3/day and a thermal system is economic i.e., disposal costs >$10/m3, it may make more sense to skip the secondary RO and proceed directly to the thermal system. This could be especially true if chemical treatment is avoided through use of a SaltMaker evaporator crystallizer that does not require upstream pre-treatment. At higher brine flow rates, such as 500 m3/day, a secondary membrane concentrator can be highly cost advantageous.
- Simple bench or pilot tests can considerably de-risk investments and offer pay back periods of weeks to months by enabling economic and process optimization of the overall system.
- Project owners do not need to become experts in advanced brine treatment or economic optimization. Help and guidance is available on completing these calculations by contacting Saltworks at projects@saltworkstech.com.
Attached link
https://www.saltworkstech.com/articles/achieving-70x-cooling-tower-blowdown-volume-reduction/Media
Taxonomy
- RO Systems
- Cooling Boiler & Wastewater
- Cooling Systems
- Zero Discharge
- Desalination
- Reverse Osmosis
- RO & MSF Fouling
- Brine Discharge Modeling & Analysis
- Zero Liquid Discharge plants
- Zero Liquid Discharge
- Desalination