How to Read a Pump Curve
Published by RockHound Drill, Seoer at RockHound (Rhdrill.com) - Gimarpol Machinery Technology Co., Ltd in Technology
Knowing how to read a pump curve (also called ‘pump flow curve’ or ‘pump performance curve’) is essential to understanding the performance of a diaphragm pump within a specific set of operating conditions. The pump curve displays a selection of variable indicators to identify whether the pump can achieve the required flow rate at a certain pressure difference.
Email: info@slurrypumppansto.com
Mob/WhatsApp/Wechat: +86-15732149758
Web: www.slurrypumppansto.com
This is critical in selecting the right pump for a specific application. Pansto will provide instructions on how to read a pump curve correctly while looking further into the definitions and the variables each can display.
What Is A Centrifugal Pump Curve?
The pump curve charts is a curve that represents the relationship between the various performance parameters of the pump, it shows the performance and working status of the water pump under different conditions.
Pump performance curve chart contains the following information:
- Pump Head
- Flow Rate
- NPSH (Net Positive Suction Head)
- Impeller Size and Pump Performance
- Pump Efficiency Curve
- RPM (Revolutions Per Minute)
- BEP (Best Efficiency Point)
The centrifugal pump curve is not only an important tool for pump selection, but also a reference in maintenance work to check whether the status of various operating points of the pump deviates from the values recommended by the pump characteristic curve.
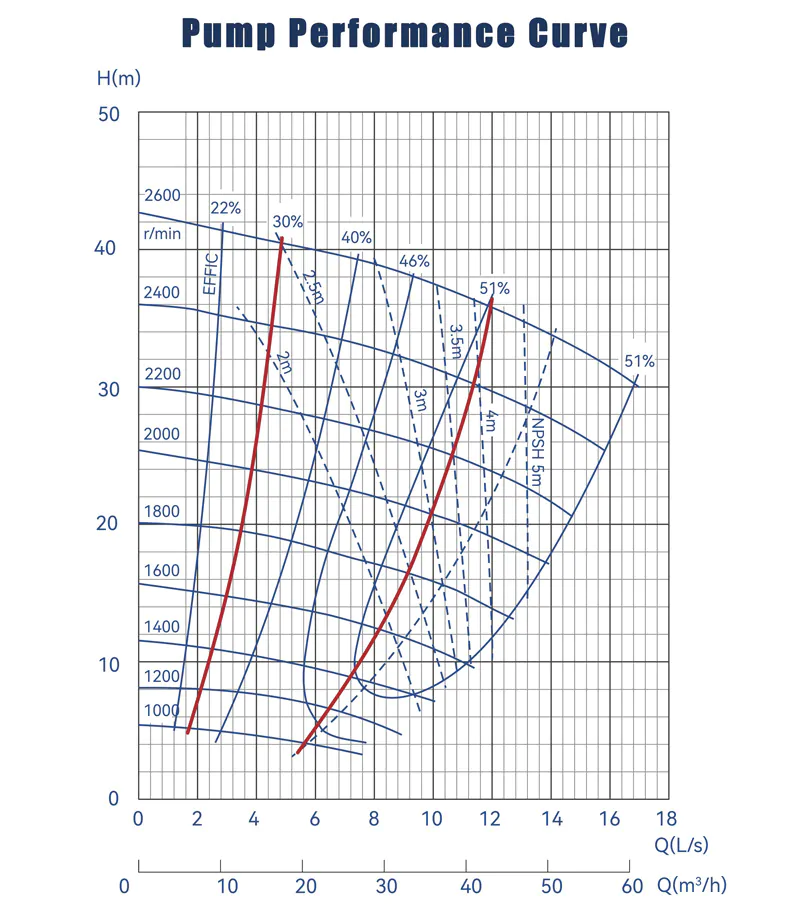
Fig. The Y-axis represents head in meters, and the X-axis represents flow rate in m³/h, or L/s.
The red line represents the pump’s optimal efficiency range, where the pump achieves high efficiency and minimizes wear.
How to Read A Pump Performance Curve?
Engineers usually use pump performance curves to make initial pump selections. By using the information on the pump curve, such as pump head and flow rate, and their intersection, we can roughly select the pump model. If you want to understand the pump performance curve, you must first understand the various performance parameters of the pump. Please continue reading the following content to help you thoroughly understand the pump performance curve.
1. Pump Head
The Y-axis of the pump curve represents pump head, which represents the height to which a pump can pump liquid. Simply put, it’s the vertical distance between the pump outlet and the final pumping height. In actual calculations, factors such as elbow losses and pipe friction must also be considered.
The following is a more detailed explanation of pump head, Total Dynamic Head .
Total Dynamic Head
What is TDH in Pump Curve? To put it simply, we usually use the Y-axis of the pump curve to represent TDH. The total dynamic head of the pump is the sum of the static lift, pressure head, power head, friction loss and other factors of the pump. It can be understood as the height to which the pump can lift the fluid after considering the above factors. It is usually expressed in meters or inches.
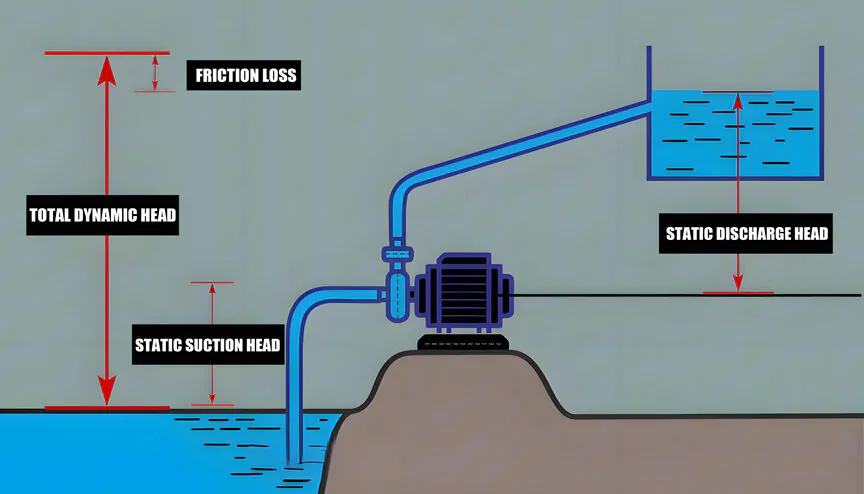
How to Calculate Total Dynamic Head?
TDH = Static Lift + Pressure Head + Velocity Head + Friction Loss
- Static Lift: Static lift refers to the height difference between the pump suction port and the liquid surface when the pump is stationary.
- Pressure Head: The pressure head is the static pressure provided by the fluid. That is to say, it refers to the head formed by the pressure of the fluid in the pipeline. Different pressure heads will be generated at the suction and discharge ends of the pump. The greater the pressure of the fluid, the greater the pressure head.
- Velocity Head: Velocity head is the height to which the kinetic energy of the fluid lifts the fluid during its flow. The greater the velocity of the fluid, the greater the velocity head.
- Friction Loss: Friction loss is the energy loss generated in the elbows, valves and pipes of the pipeline when the pump is transporting fluid.
Total Dynamic Head Formula
TDH=H static + H pressure + H velocity + H friction
![]()
2. Flow Rate
The X-axis of the pump performance curve represents the flow rate, which can be understood as the volume of fluid that the pump can deliver per unit time. It is usually expressed in cubic meters per hour (m³/h) or liters per second (L/s).
3. Pump Curve Best Efficiency Point
The pump has the highest efficiency and the lowest wear under this operating state .
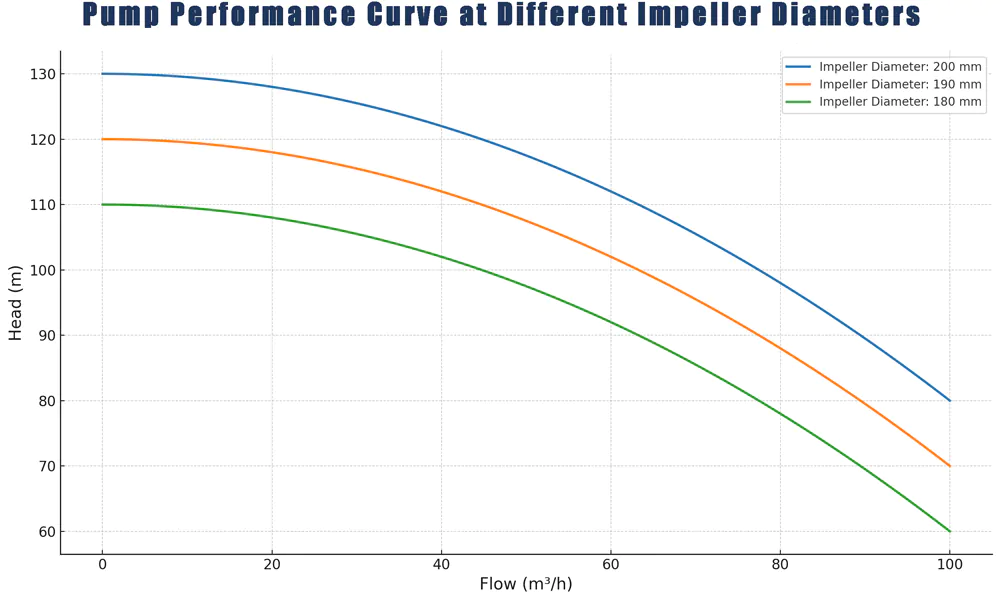
4. Impeller Size and Pump Performance
Impeller size affects pump performance. Increasing the impeller size increases the pump’s flow rate because a larger impeller can push more liquid. According to the affinity law: H ∝ D², where D is the impeller diameter, increasing the impeller size also increases the pump’s head.
However, it’s important to consider that simply increasing the impeller size doesn’t necessarily improve efficiency. A larger impeller requires a higher-powered motor to maintain rotation. You need to find the optimal efficiency point on the pump curve.
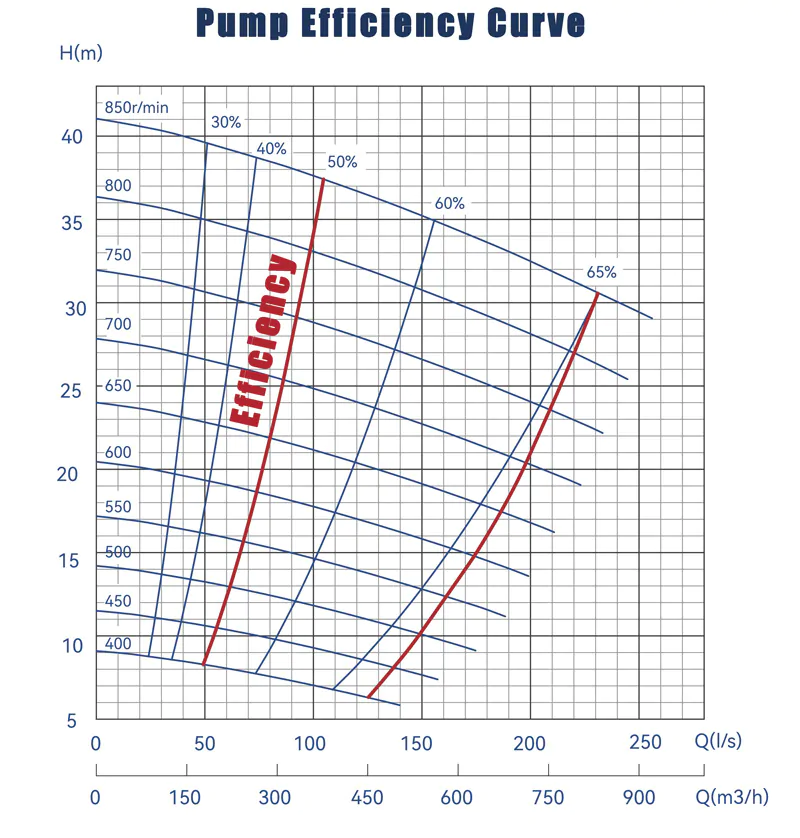
5. Pump Efficiency Curve
The pump efficiency curve is crucial in pump analysis because it tells us how efficiently a pump operates under different conditions—that is, how much of the motor’s input power is used to move liquid.
The pump efficiency curve also helps us identify the BEP (Best Efficiency Point) and the high efficiency range. The BEP or high efficiency range is where a pump achieves maximum performance and minimizes wear.
6. RPM
The speed of the pump has a significant impact on the head and flow rate during actual operation. The speed at the best efficiency point should be considered when selecting a pump.
7. NPSH
Net Positive Suction Head is an important indicator for preventing cavitation during pump operation. NPSH has two parameters.
- NPSH A: The NPSH required for the pump in actual operation.
- NPSH R: The minimum NPSH required for the pump to operate.
When designing a pump delivery solution, NPSH A > NPSH R must be metto ensure that there is sufficient pressure at the pump suction end to prevent cavitation from occurring in the pump.
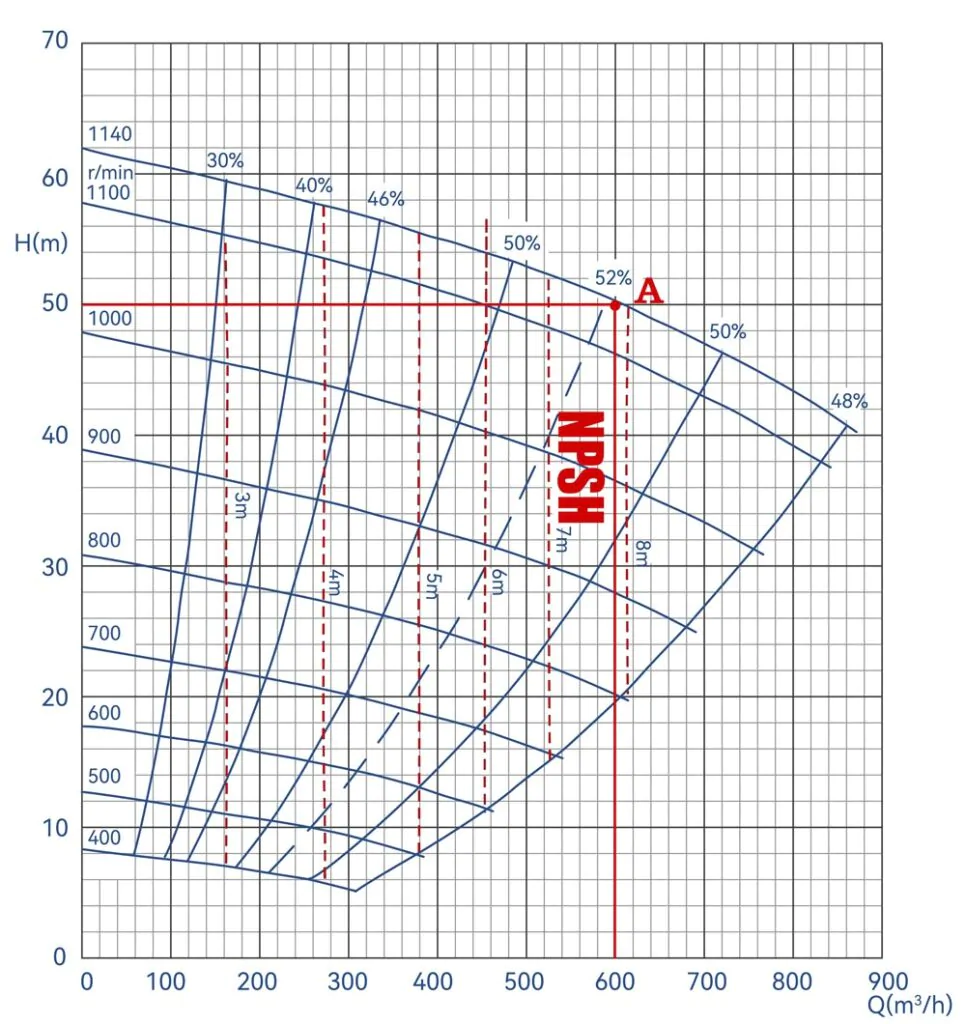
How to Read NPSH on Pump Curve?
On a pump curve, NPSH is the dashed line perpendicular to the X-axis.
We can see that different positions have different NPSH values. In the above content, we have mentioned that NPSH includes NPSH A (NPSH actually required during operation) and NPSH R (minimum NPSH required for operation). Please note that NPSH A > NPSH R must be ensured to ensure that cavitation does not occur in the pump.
We have determined the location of point A, and we can see that point A is near the range of NPSH R of 8m. So we can determine that when designing the pump delivery system, we must ensure that NPSH A >8m to better prevent cavitation.
Although the pump curves provided by each pump manufacturer are not exactly the same, if you can understand the meaning of the various parameters in the pump performance curve, you can make simple pump selection based on the pump curves provided by the manufacturer .
Tags
Category: Technology
- Pump Supplier
- Centrifugal Pumps & Pumping Systems
- Pumping System Design
- Pumps Installation
- Slurry Pumping
- Pump
- Pump
- Pumps and Pumping Systems