Instant Analysis Helps Scientists Spot Lagoon-Algae Hotspots
Published on by Water Network Research, Official research team of The Water Network in Academic
Lagoon-Algae Hotspots Analysis
These days, boats get the scoop on algae blooms.
State researchers now pull water samples via a moving boat, rather than just by hand for later scrutiny, giving much quicker snapshots of algae "hot spots" in the Indian River Lagoon.
"It's almost more like a storm chaser," Brandon Basino, a spokesman for the Florida Fish and Wildlife Conservation Commission, said of the agency's new algae-monitoring system.
FWC established a new program this year that instantly analyzes water quality with a research vessel that cruises the lagoon and other waters. The agency formerly tracked algae blooms by collecting water samples by hand and taking them back to a lab for analysis.
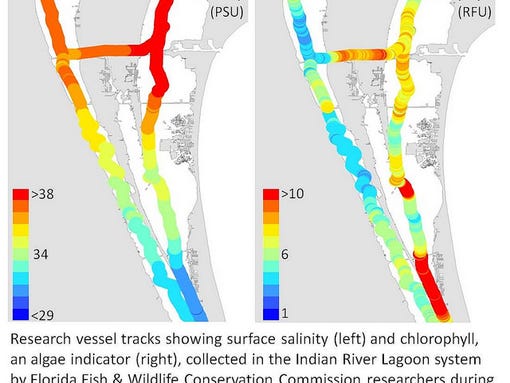
The new "flow-through" system pumpswater from the surface through instruments that measure salt levels, temperature and chlorophyll fluorescence, an indicator of algae. The data is then integrated with geographic coordinates to make maps of algae "hot spots."
FWCmaps the lagoon between June and August, when algae typically blooms. The real-time data allows researchers to adjust sampling locations based on algae patches they find in the field. They also collect samples at set locations to be analyzed for the amount and diversity of algae. That sampling is conducted in partnership with the University of Florida and the St. Johns River Water Management District.
Beyond improving short-term algae bloom detection, the researchers say the new method will help identify the long-term causes of the blooms, leading to better management strategies.
To learn about Florida's harmful algal bloom program, visithere
This map displays bloom data collected during harmful algal bloom sampling in the Indian River Lagoon in June 2014.(Photo: FWC)
Here's The Bitly Link to Include In Your Share:http://bit.ly/1kmg4ty
Media
Taxonomy
- Technology
- Ecosystem Management
- Algae
