Millennia of Sea-level Change
Published on by Ashantha Goonetilleke, Professor, Water/Environmental Engineering at Queensland University of Technology in Academic
How has global sea level changed in the past millennia? And how will it change in this century and in the coming millennia? What part do humans play? Several new papers provide new insights.
2500 years of past sea level variations
This week, a paper will appear in the Proceedings of the National Academy of Sciences (PNAS) with the first global statistical analysis of numerous individual studies of the history of sea level over the last 2500 years (Kopp et al. 2016 – I am one of the authors). Such data on past sea level changes before the start of tide gauge measurements can be obtained from drill cores in coastal sediments. By now there are enough local data curves from different parts of the world to create a global sea level curve.
Let’s right away look at the main result. The new global sea level history looks like this:
Fig. 1 Reconstruction of the global sea-level evolution based on proxy data from different parts of the world. The red line at the end (not included in the paper) illustrates the further global increase since 2000 by 5-6 cm from satellite data.
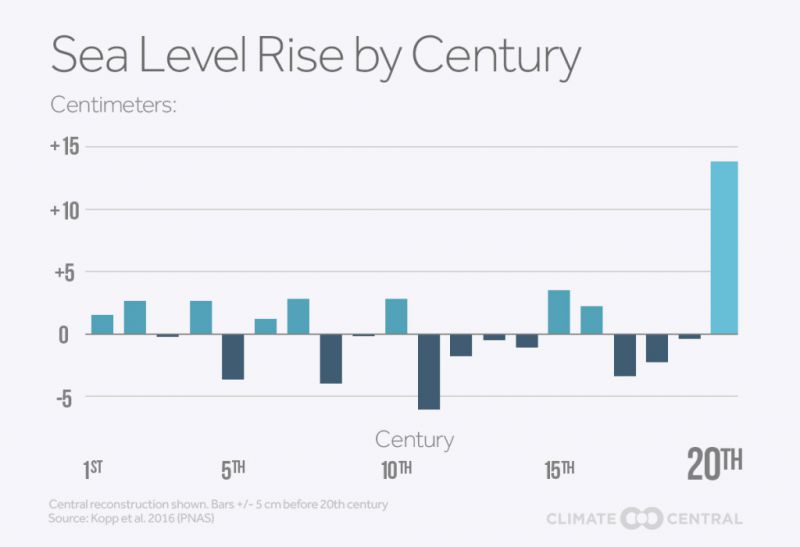
Fig. 2 Sea-level change during each of the twenty centuries of the Common Era (Graph: Climate Central.)
The fact that the rise in the 20th century is so large is a logical physical consequence of man-made global warming. This is melting continental ice and thus adds extra water to the oceans. In addition, as the sea water warms up it expands. (A new study has also just been published about the size of individual contributions derived from satellite data: Rietbroek et al 2016).
The paleoclimatic data reaching back for millennia can be used to better separate the natural variations in sea level and the human impact. With near-certainty at least half of the rise in the 20th century is caused by humans; possibly all of it. From natural causes alone sea level might also have fallen in the 20th century, instead of the observed rise by close to 15 centimeters.
What will happen in the 21st century?
The data from the past can also be used for future projections, using a so-called semi-empirical model calibrated with the historically observed relationship between temperature and sea level. With the new data, this results in a projected increase in the 21st century of 24-131 cm, depending on our emissions and thus on the extent of global warming.
This brings us to a second study, also published this week in PNAS (Mengel et al. 2016). In this paper a new method of sea-level projections is developed. It is not based on complex models, but also on simple semi-empirical equations. But not for sea level as a whole but for the individual causes of sea-level changes: thermal expansion of sea water, melting of glaciers and mass loss of the large ice sheets. These equations are calibrated based on data from the past and then extrapolated to a warmer future. It is a kind of hybrid between the semi-empirical and the process-based approach (favored by the IPCC) to sea-level projections. The following table compares the projections of the various methods.
To understand this curve we need to know one thing. There is a remaining uncertainty in the linear trend over the whole period. This is because in many places of the world slow processes, especially continuing land uplift or subsidence after the end of the last Ice Age, cause a sea-level trend uncertainty (because land subsidence is not the same as sea level rise, this needs to be subtracted). It is therefore the fluctuations around the linear trend which are the most robust aspect of these data. The uncertainty in the trend is small, only 0.2 mm/year (the current sea level rise is 3 mm/year). But even a small steady trend of 0.2 mm/year amounts to half a meter during 2500 years. For the graph above, this means that the correct curve could be “tilted” a little to the left or right. This would, for example, change the relative global sea level in 2000 compared to the Middle Ages – this relative height does not belong to the robust results, as stated in the paper.
In contrast, a robust result is the fact that sea level has risen more during the 20th century than during any previous century. (This statement is true regardless of an additive trend.) A good way to show this is the following graph.
Taxonomy
- Environment
- Climate Change