Modeling the Effect of Irrigation on the Rio Grande's Efficiency
Published on by Water Network Research, Official research team of The Water Network in Academic
Surface and groundwater use in southern New Mexico has been in the news lately for a variety of reasons including the lack of precipitation in the state this winter, and also for water adjudication on the lower Rio Grande.
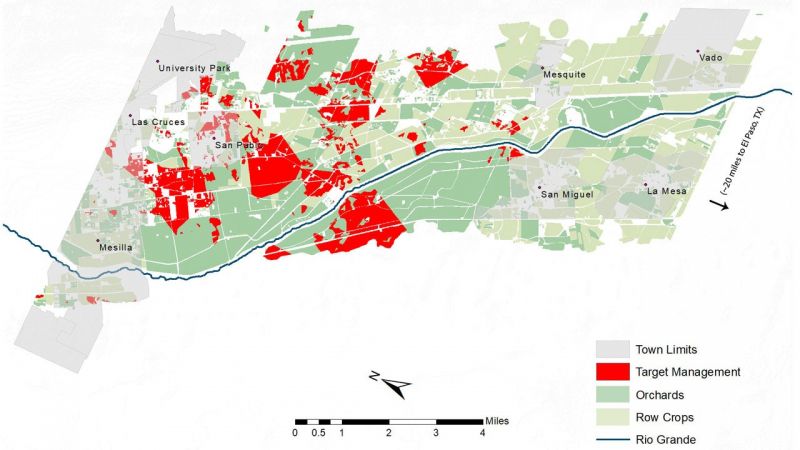
The University of New Mexico’s Department of Geography & Environmental Studies features graduate student Daniel Beene’s map of surface water and groundwater use south of Las Cruces in New Mexico as its January 2018 Map of the Month.
Beene wanted to draw a causal relationship between water adjudication on the Lower Rio Grande and the U.S. Supreme Court lawsuit, in which Texas is suing New Mexico over not delivering its legal share of water.
Source: UNM Newsroom
Beene relied on two types of data for his map, “Water Use, Efficiency, and the River: Modeling the Effect of Irrigation on the Rio Grande’s Efficiency.” He obtained well-point data from the New Mexico Office of the State Engineer for more than 10,000 wells and used that information to interpolate the area’s water table.
He also pulled water rights files from the state to understand the conjunctive use for farms in the area. Those files show where a well has been drilled, the farm’s acreage, how much surface water the farm is using, and how much groundwater is being pumped.
The first year graduate student says the map can be used to visualize how management practices can inhibit ecological systems. He doesn’t mean to imply, he says, that the farms are doomed—or that the farms are dooming the state. Rather, the map illustrates that behavior and the decision-making process can be changed.
In early-January, the U.S. Supreme Court heard oral arguments in Texas v. New Mexico and Colorado. Texas alleges that by allowing farmers in southern New Mexico to pump groundwater, which is hydrologically connected to the Rio Grande, the state is violating the Rio Grande Compact and not sending its legal share of water to Texas.
Now, the federal government wants to join the case against the two upstream states, arguing that New Mexico’s actions are affecting its ability to deliver water to Mexico and make compact deliveries. While the parties have not clarified their demands, were New Mexico to lose the case, the state could owe a billion dollars or more in damages to Texas and be forced to curtail groundwater pumping in the lower Rio Grande.
Due to the pending Supreme Court case, Beene’s map is particularly timely. But he actually designed the map for Geography 587, Spatial Analysis and Modeling—and his poster won the 2017 GIS Day prize during the fall semester at UNM, which drew more than 20 other entries. Since groundwater pumping is the main issue within the longstanding case, however, his map provides a unique view on what’s happening on and below farmlands within the Lower Rio Grande Valley in New Mexico, and how people might think about solutions to the conflict.
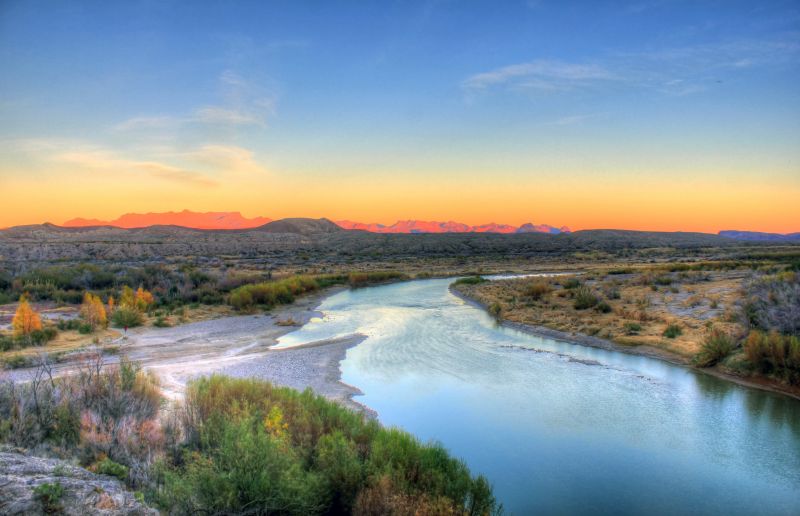
Rio Grande, source: Good Free Photos, Labeled for Reuse
Yan Lin, assistant professor in Department of Geography & Environmental Studies, who teaches Geography 587, says Beene’s map “addresses a critical issue on the interaction between groundwater extraction and the Rio Grande in New Mexico, which is an area of research important to both the scholarship and local community.”
She points out that it implemented spatial analysis and modeling methods—such as kriging, multi-criteria decision analysis and fuzzy logic—to model areas of over-extraction that were identified as target management areas in the Rio Grande Basin.
“A multicriteria decision analysis model was developed based on six factors: water table, groundwater use, surface water use, hotspots of water use area, distance to river and soil permeability,” she said. “Fuzzy logic techniques were used to compute the probability of over-extraction in the study area.”
His work was computationally intensive, she says, referring to the 10,495 wells Beene looked at, and it also included a validation process for modeled results—which she points out is crucial for this type of research.
“In addition to the merits of the research presentation, the poster is clearly organized with narratives, maps and other graphics that are easy for the public to understand, despite its challenging technical content,” Lin says.
For more information, visit Water Use, Delivery and The River
Source: The University of New Mexico
Media
Taxonomy
- Irrigation
- Resource Management
- Water Resource Mapping
- River Studies
- River Engineering
- Consumption
- River Engineering
- Irrigation Agronomy