Researchers Issue First-annual Sea-level Report Cards
Published on by Water Network Research, Official research team of The Water Network in Academic
Interactive graphs project sea-level changes to 2050 for 32 U.S. localities.
Researchers at William & Mary’s Virginia Institute of Marine Science are launching new web-based “report cards” to monitor and forecast changes in sea level at 32 localities along the U.S. coastline from Maine to Alaska. They plan to update the report cards in January of each year, with projections out to the year 2050.
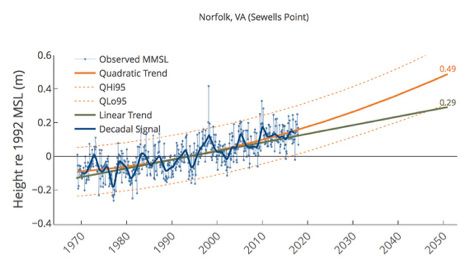
2050 Projection A screenshot of the 2050 projection of sea level in Norfolk, Virginia. VIMS' Sea-Level Report Cards provide similar interactive projections for 32 U.S. coastal localities from Maine to Alaska. Source: VIMS
The lead on the project, VIMS emeritus professor John Boon, says the report cards are designed to add value by providing sea-level updates that are more frequent and localized than those generated by NOAA or other scientific bodies. Boon and colleagues also take a statistical approach that incorporates evidence for recent acceleration in the rate of sea-level change at many U.S. tide-gauge stations.
Boon and his team furthermore stress their use of relative sea-level measurements—changes in water level relative to the land surface on which people live and work—rather than the absolute sea-level measures used in many global models and predictions. Relative sea level is increasing in Virginia and other East and Gulf coast areas due to both rising water and sinking land.
Joining Boon on the project are Ph.D. student Molly Mitchell and assistant research scientist Derek Loftis. Mitchell is lead author on the 2012 sea-level report requested by Virginia’s General Assembly, while Loftis helps direct StormSense, a project to monitor and model coastal flooding in and around Hampton Roads. Boon created VIMS’ popular Tidewatch network and has literally written the book on the analysis of tides and tidal currents.
The value of an annual, localized report card
Because long-term changes in sea level are incremental in nature— typically a few millimeters per year—researchers have traditionally felt little need to issue frequent forecasts of sea-level changes. Moreover, many sea-level projections are global in scope, with a forecast horizon of 2100—far enough off to allow for readily discernible linear change. Thus the IPCC’s oft-reported prediction of 65 centimeters (2.1 feet) of global sea-level rise by the end of the century.
The VIMS team has purposefully taken a more localized and timely approach, one designed to add maximum value for coastal residents, businesses, and government agencies.
Says Boon, “Our report cards show what sea level has been doing recently, what’s happening now at your locality. Numerous studies show that local rates of sea-level rise and acceleration differ substantially from the global rates published by the IPCC and NOAA—a key result because local rates of relative sea-level rise give a direct indication of the extent to which homes, buildings, and roads are at risk of flooding.”
The team’s decision to use a subset of available tide-gauge data also runs counter to the traditional approach taken by researchers at NOAA, the agency that operates the nation’s official network of tidal stations.
“NOAA should be commended for their care in ensuring the continuity, consistency, and availability of the nation’s long-term tidal datasets,” says Boon. “But at the same time, a longer record isn’t always better, especially when there’s evidence of recent non-linear changes in the rate of sea-level rise like we see along the U.S. East Coast.”
An earlier analysis by Boon showed that this non-linear change or acceleration began in 1987, at the center of a 36-year sliding window beginning in 1969—thus setting the start date for the VIMS report cards. This is decades after many U.S. tide-gauge stations began operation.
Mitchell explains further, “If you cross a threshold in terms of something like sea-level rise, what came before—say a tide-gauge record that began in 1900—is biased in terms of seeing where you’re going. We think the ice sheets are melting faster today than they ever have before, and if that's true then the previous 90 years of data won’t accurately predict the future.”
Read full article: Virginia Institute of Marine Science
Media
Taxonomy
- Data Management
- Remote Sensing & Data Analysis
- Environment
- Marine
- Oceanographic Survey
- Climate
- Ocean engineering
- Data & Analysis