Visualizing Water Infrastructure with Sankey Maps
Published on by Water Network Research, Official research team of The Water Network in Academic
Visualizing water infrastructure with Sankey maps: a case study of mapping the Los Angeles Aqueduct, California
ABSTRACT
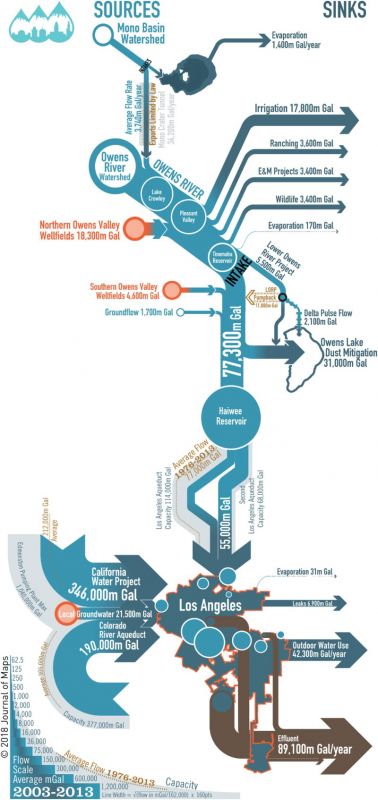
Creating resilience for urban water supply systems requires innovative thematic visualizations of the interface between infrastructure, ecology, and culture to viscerally engage lay audiences in the policy making process. Sankey maps (a hybrid Sankey diagram/flow map) embed the systemic accounting of flows between sources and sinks into a spatial framework.
This allows a hierarchy of visual variables to encode environmental conditions and historical data, providing a rich multivariate context supporting public discourse, policy making, and system operations. The article features a Sankey map of the Los Angeles Aqueduct system (California, USA) (not to scale).
KEYWORDS: Flow visualization, public engagement, sustainability, visual variables, water infrastructure
Author: Barry Lehrman
https://doi.org/10.1080/17445647.2018.1473815
Read and download full paper: Taylor & Francis Online
Source: Journal of Maps, From the paper
Media
Taxonomy
- Urban Drainage
- Water Resource Mapping
- Integrated Urban Water Management
- Urban Water
- Urban Resource Management
- Urban Water Supply
- Infrastructure
- Integrated Infrastructure
- Urban Water Infrastructure
- Infrastructure Management
- Urban Design
- green infrastructure