Data-driven analysis of drinking water and sewer rates in 50 of the largest cities in the U.S.
Published by Water Network Research, Official research team of The Water Network for Bluefield Research in Business
SEE FULL REPORT ATTACHED
Background & Summary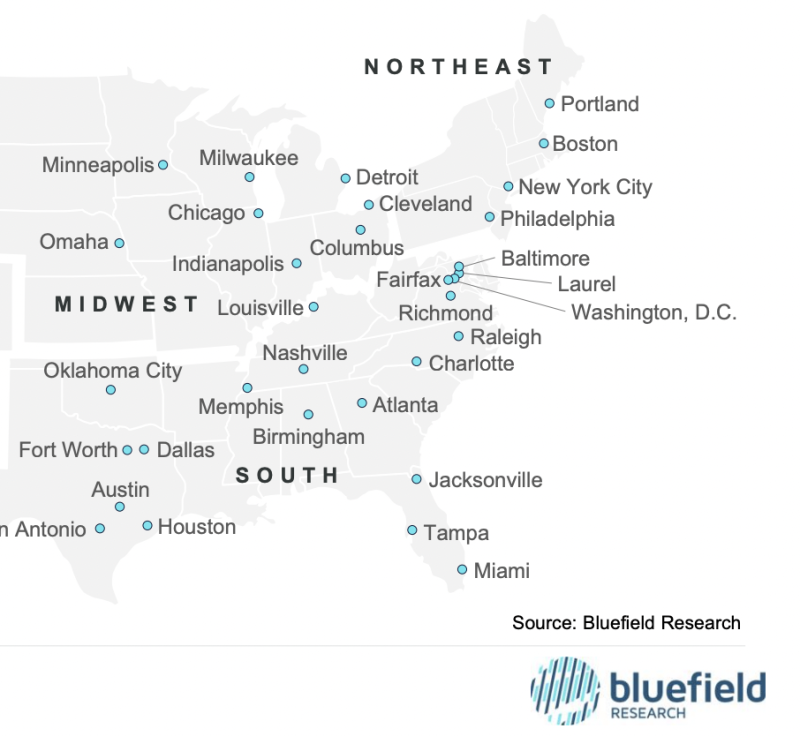
Bluefield Research offers a data-driven
analysis of drinking water and sewer rates in
50 of the largest cities in the U.S. This
analysis provides insights into how rising
costs and increasing infrastructure demands
are affecting residential utility bills over time.
It highlights the crucial role of ratepayers as
the cornerstone for funding municipal
operating expenses and demonstrates the
cascading effects of utility investments on
American households.
The U.S. water sector, which includes approximately 50,000 community water
systems and 24,000 wastewater treatment
facilities, is facing mounting financial
pressures. Factors such as aging
infrastructure, urban growth, water quality
regulations, and workforce challenges are
driving consistent increases in operating
expenditures (OPEX) and capital
expenditures (CAPEX), trickling down into
higher service charges for residents.
While national trends indicate a steady rise
in rates, specific circumstances for each
utility—including regional politics, climate
impacts, and consumer behavior—intensify
pricing disparities. Furthermore, long-term
rate planning is complicated by local factors
such as economies of scale, dependence on
groundwater or surface water, population
density, poverty rates, and geographic
nuances.
Given this complexity, Bluefield Research
emphasizes the critical need for innovative
strategies that promote financial
sustainability, equity, and resilience to
ensure the delivery of essential water
services amid unprecedented challenges.
This Data Insight provides a comprehensive
overview of the 2025 water and sewer utility
rate landscape across 50 of the largest U.S.
cities. It offers insights into trends in
infrastructure investment, affordability
challenges, and regulatory requirements for
the utilities that serve the water and
wastewater needs of approximately 20% of
the U.S population.
Built on years of data and analysis, Bluefield
Research’s U.S. & Canada Municipal Water
Market Corporate Subscription has become a
key resource for companies across the value
chain to identify the key verticals, trends, and
opportunities that stand out in an already
crowded field with increasing competition.
• Increasing rates amid infrastructure needs: From 2024 to 2025, the average combined
household water and sewer bill increased by 5.1%. This rise was driven by escalating
operational costs, inflation, and necessary capital investments to upgrade aging
infrastructure. Over the past five years, the average combined water and sewer bill has
surged by 24.2%, reflecting persistent cost pressures.
• Sewer costs dominate bills: In 2025, sewer charges comprised approximately 57% of
the combined utility bills, often surpassing water charges due to higher maintenance and
treatment expenses. On average, sewer costs have exceeded water provision costs by
US$19.23 per month since 2020.
• Regional disparities in rates: Among the municipalities analyzed, households in the
Northeast faced the highest average combined bills in 2025, totaling US$147.00 per
month, while those in the South reported a lower average of US$124.29. Based on a
national consumption factor, monthly water and sewer bills varied significantly. While
estimated water bills ranged from US$25.27 in Memphis, Tennessee, to US$129.15 in San
Francisco, California, estimated sewer bills ranged from US$12.14 in Long Beach,
California, to US$185.68 in Seattle, Washington.
• Affordability challenges: Affordability is a growing concern, with minimum-wage earners
in certain cities needing to work over 20 hours to cover their monthly utility bills in 2025,
compared to a national average of 11.5 hours. A number of major municipal utilities (e.g.,
Seattle, Washington; San Antonio, Texas; and Philadelphia, Pennsylvania) are
implementing customer assistance programs (CAPs) and other affordability measures to
support individuals based on factors such as income, age, and veteran status.
• Evolving utility strategies: To further address affordability and growing infrastructure
needs, utilities are adopting tiered pricing and seasonal rate structures. Additionally, they
are becoming more transparent about how ratepayer dollars are being spent on critical
capital and operational expenses to justify rate adjustment decisions. However, these
strategies vary considerably from city to city, reflecting the fragmented nature of the water
sector.
Tags
Category: Business
- Combined Sewer
- Research
- Affordability
- Water Utility
- Water Rates
- Water and Wastewater
- United States