Zero Liquid Discharge Systems Market by System (Conventional, Hybrid), Process (Pretreatment, Filtration, Evaporation & Crystallization), End-Use Industry (Energy & Power, Chemicals & Petrochemicals, Food & Beverages), and Region - Global Forecast to 2021
By: marketsandmarkets.com
Publishing Date: May 2017
Report Code: CH 5288


The zero liquid discharge systems market is projected to grow from an estimated USD 4.67 Billion in 2016 to USD 6.88 Billion by 2021, at a CAGR of 8.1% from 2016 to 2021.
The main objectives of this market study are:
- To define and segment the zero liquid discharge systems market on the basis of system, process, end-use industry, and region
- To estimate and forecast the market, in terms of value
- To identify and analyze key drivers, restraints, opportunities, and challenges that influence the growth of the market
- To analyze significant region-specific trends in North America, Europe, Asia-Pacific, the Middle East & Africa, and Latin America
- To strategically identify and profile key players and analyze their shares in the zero liquid discharge systems market
- To analyze recent market developments and competitive strategies such as contracts, expansions, alliances, joint ventures, and mergers & acquisitions to draw the competitive landscape of the zero liquid discharge systems market
The years considered for the report are:
- Base Year - 2015
- Estimated Year - 2016
- Projected Year - 2021
- Forecast Period - 2016-2021
The base year considered for company profiles is 2015; where the information was not available for the base year, the prior year was taken into consideration.
Research Methodology:
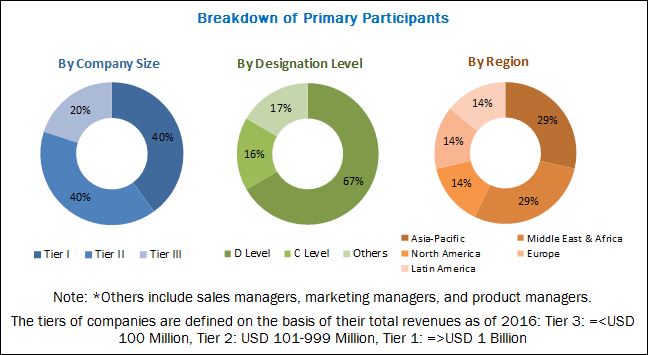
Secondary sources such as company websites, directories, and database such as Hoovers, Bloomberg, Factiva, and other government and private websites have been used to identify and collect information that is useful for this extensive commercial study of the zero liquid discharge systems market. Primary sources, which include experts from related industries, have been interviewed to verify and collect critical information as well as to assess the prospects of the market. The top-down approach has been implemented to validate the market size. With the data triangulation procedure and validation of data through primaries, exact values of the overall parent market size and individual market sizes have been determined and confirmed in this study. The breakdown of primaries conducted is shown in the figure below.
To know about the assumptions considered for the study, download the pdf brochure
Market Ecosystem:
The ecosystem of the zero liquid discharge systems market consists of suppliers of equipment and components such as evaporators, crystallizers, and membranes, among others. Several companies such as Aquatech International LLC (U.S.), GE Water & Process Technologies (U.S.), Veolia Water Technologies (France), GEA Group AG (Germany), Praj Industries Ltd. (India), H2o GmbH (Germany), U.S. Water Services, Inc. (U.S.), Aquarion AG (Switzerland) and Saltworks Technologies Inc. (Canada) are engaged in turnkey projects and supply of consumables of zero liquid discharge plants. The demand side users include companies from the energy & power, chemicals & petrochemicals, food & beverages, textiles, pharmaceuticals, and semiconductors & electronics, among other industries, which use zero liquid discharge systems for various applications such as for the reduction of brine concentration in the discharged liquid, and zero liquid discharge from the sludge.
Target Audience of the Report:
- Zero liquid discharge component/equipment manufacturers
- Companies engaged in turnkey projects and Engineering, Procurement, & Construction (EPC)
- End-use industries in the zero liquid discharge system value chain
- Government and research organizations
- Associations and industrial bodies
- Research and consulting firms
- R&D institutions
- Environment support agencies
- Investment banks and private equity firms
Scope of the Report:
- By System:
- Conventional ZLD System
- Hybrid ZLD System
- By Process:
- Pretreatment
- Filtration
- Evaporation & Crystallization
- By End-Use Industry:
- Energy & Power
- Chemicals & Petrochemicals
- Food & Beverages
- Textiles
- Pharmaceuticals
- Semiconductors & Electronics
- Others (Paper & Pulp, Metal & Mining, & Tanneries)
- By Region:
- North America
- U.S.
- Canada
- Mexico
- Europe
- U.K.
- Germany
- France
- Italy
- Spain
- Russia
- Rest of Europe
- Asia-Pacific
- China
- Japan
- India
- South Korea
- Taiwan
- Australia
- Rest of Asia-Pacific
- Latin America
- Brazil
- Argentina
- Rest of Latin America
- Middle East & Africa
- Saudi Arabia
- UAE
- South Africa
- Israel
- Qatar
- Rest of the Middle East & Africa
- North America
Available Customizations:
With the given market data, MarketsandMarkets offers customizations according to the companys specific needs.
The following customization options are available for the report:
Product Analysis
- Product matrix, which gives a detailed comparison of the product portfolio of each company
Country Level Analysis
- Further breakdown of the zero liquid discharge systems market by major countries from the Europe region including Denmark, Switzerland, Belgium, the Netherlands, and so on.
- Further breakdown of the zero liquid discharge systems market by major countries from Asia-Pacific region including Indonesia, Philippines, New Zealand, Thailand, Malaysia, and so on.
- Further breakdown of the Middle East & Africa zero liquid discharge systems market into Iran, Oman, Kuwait, Turkey, Iraq, Egypt, Libya and so on.
- Further breakdown of the Latin America zero liquid discharge systems market into Chile, Venezuela, and so on.
Company Information
- Detailed analysis and profiles of additional market players.
Table of Contents
1 Introduction (Page No. - 14)
1.1 Objectives of the Study
1.2 Market Definition
1.3 Market Scope
1.4 Years Considered for the Study
1.5 Currency Considered
1.6 Stakeholders
1.7 Limitations
2 Research Methodology (Page No. - 17)
2.1 Research Data
2.1.1 Secondary Data
2.1.1.1 Key Data From Secondary Sources
2.1.2 Primary Data
2.1.2.1 Key Data From Primary Sources
2.1.2.2 Key Industry Insights
2.1.2.3 Breakdown of Primary Interviews, By Company, Designation, and Region
2.2 Market Size Estimation
2.3 Data Triangulation
2.4 Assumptions
2.5 Limitations
3 Executive Summary (Page No. - 23)
4 Premium Insights (Page No. - 28)
4.1 Attractive Opportunities in the Zero Liquid Discharge Systems Market
4.2 Zero Liquid Discharge Systems Market, By Region
4.3 Zero Liquid Discharge Systems Market, By Process
4.4 Zero Liquid Discharge Systems Market, By Process and End-Use Industry
4.5 Zero Liquid Discharge Systems Market Growth
5 Market Overview (Page No. - 31)
5.1 Introduction
5.2 Market Dynamics
5.2.1 Drivers
5.2.1.1 Implementation of Stringent Environmental Regulations and Water Scarcity Across the Globe are Leading to Increased Adoption of Zero Liquid Discharge Systems
5.2.2 Restraints
5.2.2.1 High Costs of Installation and Operations of Zero Liquid Discharge Systems
5.2.3 Opportunities
5.2.3.1 Increasing Concerns Over the Disposal of Brine Concentrates Into Oceans
5.2.4 Challenges
5.2.4.1 Lack of Awareness Regarding Disposal of Wastewater Concentrates in Various Regions, Such as the Middle East & Africa and Latin America
6 Industry Trends (Page No. - 35)
6.1 Introduction
6.2 Revenue Pocket Matrix
6.3 Zero Liquid Discharge Processes
6.3.1 Pretreatment Process
6.3.2 Filtration Process
6.3.3 Evaporation Process
6.3.4 Crystallization Process
6.4 Zero Liquid Discharge Systems - Technical Overview
6.4.1 Reverse Osmosis (RO)
6.4.1.1 High-Efficiency Reverse Osmosis (HERO)
6.4.2 Ultrafiltration (Uf)
6.4.3 Evaporation & Crystallization
6.4.3.1 Hpd Evaporation and Crystallization Technology
6.4.3.2 Cold Process
6.5 Porters Five Forces Analysis
6.5.1 Bargaining Power of Suppliers
6.5.2 Threat of New Entrants
6.5.3 Threat of Substitutes
6.5.4 Bargaining Power of Buyers
6.5.5 Intensity of Rivalry
6.6 Economic Indicators
6.6.1 Energy & Power
6.6.2 Chemicals & Petrochemicals
6.6.3 Semiconductors & Electronics
7 Zero Liquid Discharge Systems Market, By System (Page No. - 48)
7.1 Introduction
7.2 Conventional Zero Liquid Discharge Systems
7.3 Hybrid Zero Liquid Discharge Systems
8 Zero Liquid Discharge Systems Market, By Process (Page No. - 53)
8.1 Introduction
9 Zero Liquid Discharge Systems Market, By End-Use Industry (Page No. - 56)
9.1 Introduction
9.2 Energy & Power
9.2.1 Power Generation
9.2.2 Oil & Gas
9.3 Chemicals & Petrochemicals
9.3.1 Chemical Processing
9.3.2 Petrochemical Processing
9.4 Food & Beverages
9.4.1 Food Processing
9.4.2 Beverage Processing
9.5 Textiles
9.5.1 Textile Dyeing Process
9.6 Pharmaceuticals
9.6.1 Active Pharmaceutical Ingredients (API)
9.6.2 Formulations
9.7 Semiconductors & Electronics
9.8 Others
10 Zero Liquid Discharge Systems Market, By Region (Page No. - 68)
10.1 Introduction
10.2 North America
10.2.1 U.S.
10.2.2 Canada
10.2.3 Mexico
10.3 Europe
10.3.1 U.K.
10.3.2 Germany
10.3.3 France
10.3.4 Italy
10.3.5 Spain
10.3.6 Russia
10.3.7 Rest of Europe
10.4 Asia-Pacific
10.4.1 China
10.4.2 Japan
10.4.3 India
10.4.4 South Korea
10.4.5 Taiwan
10.4.6 Australia
10.4.7 Rest of Asia-Pacific
10.5 Middle East & Africa
10.5.1 Saudi Arabia
10.5.2 United Arab Emirates (UAE)
10.5.3 South Africa
10.5.4 Israel
10.5.5 Qatar
10.5.6 Rest of Middle East & Africa
10.6 Latin America
10.6.1 Brazil
10.6.2 Argentina
10.6.3 Rest of Latin America
11 Competitive Landscape (Page No. - 101)
11.1 Introduction
11.1.1 Vanguards
11.1.2 Innovators
11.1.3 Dynamic
11.1.4 Emerging
11.2 Competitive Benchmarking
11.2.1 Product Offerings (For All 25 Players)
11.2.2 Business Strategy (For All 25 Players)
12 Company Profiles (Page No. - 105)
(Overview, Financials, Products & Services, Strategy, and Developments)*
12.1 GE Water & Process Technologies
12.2 Veolia Water Technologies
12.3 GEA Group AG
12.4 Praj Industries Ltd.
12.5 Aquatech International LLC
12.6 H2O GmbH
12.7 U.S. Water Services, Inc.
12.8 Aquarion AG
12.9 Saltworks Technologies Inc.
12.10 Doosan Hydro Technology LLC
12.11 Petro Sep Corporation
*Details on Overview, Financials, Product & Services, Strategy, and Developments Might Not Be Captured in Case of Unlisted Companies.
12.12 Other Companies in the Zero Liquid Discharge Systems Market
12.12.1 Ide Technologies
12.12.2 Degremont Technologies
12.12.3 L&T Constructions
12.12.4 Oasys Water Inc.
12.12.5 Samco Technologies Inc
12.12.6 Water Next Solutions Private Limited
12.12.7 Awas International GmbH
12.12.8 Condorchem Envitech
12.12.9 Hydro Air Research Italia
12.12.10 Mcwong Environmental & Energy Group
12.12.11 Memsys GmbH
12.12.12 Tamilnadu Water Investment Co. Ltd
12.12.13 Transparent Energy Systems Pvt. Ltd.
12.12.14 ZLD Technologies Pvt Ltd
13 Appendix (Page No. - 133)
13.1 Insights From Industry Experts
13.2 Discussion Guide
13.3 Knowledge Store: Marketsandmarkets Subscription Portal
13.4 Introducing RT: Real-Time Market Intelligence
13.5 Available Customizations
13.6 Related Reports
13.7 Author Details
List of Tables (63 Tables)
Table 1 Zero Liquid Discharge Systems Market Snapshot
Table 2 Crude Oil Trade Flow, By Region (Million Barrels Per Day)
Table 3 Global Semiconductor Sales, By Region, 2011-2014 (USD Billion)
Table 4 Global Semiconductor Sales, By Product, 2011-2014 (USD Billion)
Table 5 Zero Liquid Discharge Systems Market, By System, 2014-2021 (USD Million)
Table 6 Conventional ZLD Systems: Zero Liquid Discharge Systems Market, By Region, 20142021 (USD Million)
Table 7 Hybrid ZLD Systems: Zero Liquid Discharge Systems Market, By Region, 20142021 (USD Million)
Table 8 Zero Liquid Discharge Systems Market, By Process, 20142021 (USD Million)
Table 9 Zero Liquid Discharge Systems Market, By End-Use Industry, 20142021 (USD Million)
Table 10 Zero Liquid Discharge Systems Market By End-Use Industry in Energy & Power, By Region, 20142021 (USD Million)
Table 11 Zero Liquid Discharge Systems Market By End-Use Industry in Chemicals & Petrochemicals, By Region, 20142021 (USD Million)
Table 12 Zero Liquid Discharge Systems Market By End-Use Industry in Food & Beverages, By Region, 20142021 (USD Million)
Table 13 Zero Liquid Discharge Systems Market By End-Use Industry in Textiles, By Region, 20142021 (USD Million)
Table 14 Zero Liquid Discharge Systems Market By End-Use Industry in Pharmaceuticals, By Region, 20142021 (USD Million)
Table 15 Zero Liquid Discharge Systems Market By End-Use Industry in Semiconductors & Electronics, By Region, 20142021 (USD Million)
Table 16 Zero Liquid Discharge Systems Market By End-Use Industry in Others, By Region, 20142021 (USD Million)
Table 17 Zero Liquid Discharge Systems Market Size, By Region, 20142021 (USD Million)
Table 18 North America: By Market, By Country, 20142021 (USD Million)
Table 19 North America: By s Market, By System, 20142021 (USD Million)
Table 20 North America: By Market, By Process, 20142021 (USD Million)
Table 21 North America: By Market, By End-Use Industry, 20142021 (USD Million)
Table 22 U.S.: By Market, By End-Use Industry, 20142021 (USD Million)
Table 23 Canada: By Market, By End-Use Industry, 20142021 (USD Million)
Table 24 Mexico: By Market, By End-Use Industry, 20142021 (USD Million)
Table 25 Europe: By Market, By Country, 20142021 (USD Million)
Table 26 Europe: By Market, By System, 20142021 (USD Million)
Table 27 Europe: By Market, By Process, 20142021 (USD Million)
Table 28 Europe: By Market, By End-Use Industry, 20142021 (USD Million)
Table 29 U.K.: By Market, By End-Use Industry, 20142021 (USD Million)
Table 30 Germany: By Market, By End-Use Industry, 20142021 (USD Million)
Table 31 France: By Market, By End-Use Industry, 20142021 (USD Million)
Table 32 Italy: By Market, By End-Use Industry, 20142021 (USD Million)
Table 33 Spain: By Market, By End-Use Industry, 20142021 (USD Million)
Table 34 Russia: By Market, By End-Use Industry, 20142021 (USD Million)
Table 35 Rest of Europe: By Market, By End-Use Industry, 20142021 (USD Million)
Table 36 Asia-Pacific: By Market, By Country, 20142021 (USD Million)
Table 37 Asia-Pacific: By Market, By System, 20142021 (USD Million)
Table 38 Asia-Pacific: By Market, By Process, 20142021 (Million)
Table 39 Asia-Pacific: By Market, By End-Use Industry, 20142021 (USD Million)
Table 40 China: By Market, By End-Use Industry, 20142021 (USD Million)
Table 41 Japan: By Market, By End-Use Industry, 20142021 (USD Million)
Table 42 India: By Market, By End-Use Industry, 20142021 (USD Million)
Table 43 South Korea: By Market, By End-Use Industry, 20142021 (USD Million)
Table 44 Taiwan: By Market, By End-Use Industry, 20142021 (USD Million)
Table 45 Australia: By Market, By End-Use Industry, 20142021 (USD Million)
Table 46 Rest of Asia-Pacific: By Market, By End-Use Industry, 20142021 (USD Million)
Table 47 Middle East & Africa: By Market, By Country, 20142021 (USD Million)
Table 48 Middle East & Africa: By Market, By System, 20142021 (USD Million)
Table 49 Middle East & Africa: By Market, By Process, 20142021 (USD Million)
Table 50 Middle East & Africa: By Market, By End-Use Industry, 20142021 (USD Million)
Table 51 Saudi Arabia: By Market, By End-Use Industry, 20142021 (USD Million)
Table 52 UAE: By Market, By End-Use Industry, 20142021 (USD Million)
Table 53 South Africa: By Market, By End-Use Industry, 20142021 (USD Million)
Table 54 Israel: By Market, By End-Use Industry, 20142021 (USD Million)
Table 55 Qatar: By Market, By End-Use Industry, 20142021 (USD Million)
Table 56 Rest of Middle East & Africa: By Market, By End-Use Industry, 20142021 (USD Million)
Table 57 Latin America: By Market, By Country, 20142021 (USD Million)
Table 58 Latin America: By Market, By Systems, 20142021 (USD Million)
Table 59 Latin America: Zero Liquid Discharge Systems, By Process, 20142021 (USD Million)
Table 60 Latin America: By Market, By End-Use Industry, 20142021 (USD Million)
Table 61 Brazil: By Market, By End-Use Industry, 20142021 (USD Million)
Table 62 Argentina: By Market, By End-Use Industry, 20142021 (USD Million)
Table 63 Rest of Latin America: By Market, By End-Use Industry, 20142021 (USD Million)
List of Figures (42 Figures)
Figure 1 Zero Liquid Discharge Systems Market: Research Design
Figure 2 Market Size Estimation: Top-Down Approach
Figure 3 Market Size Estimation: Bottom-Up Approach
Figure 4 Market Breakdown and Data Triangulation
Figure 5 The Energy & Power End-Use Industry Segment is Expected to Lead the Zero Liquid Discharge Systems Market From 2016 to 2021
Figure 6 The North American Region is Estimated to Lead the Zero Liquid Discharge Systems Market in 2016
Figure 7 North America Estimated to Remain Largest Market for Zero Liquid Discharge Systems During the Forecast Period
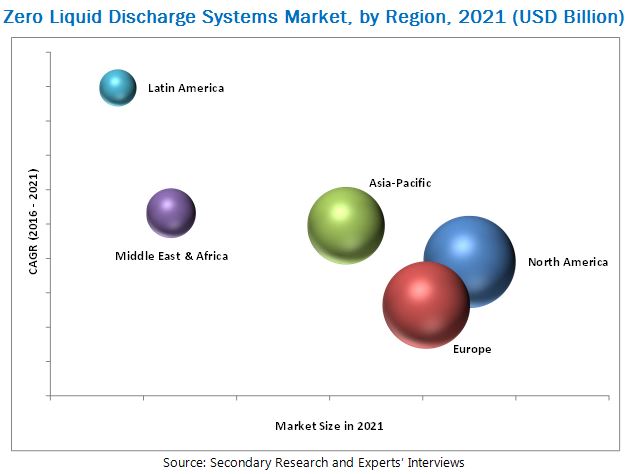
Figure 8 Zero Discharge Liquid Systems Market: Regional Snapshot
Figure 9 The Zero Liquid Discharge Systems Market is Projected to Witness Substantial Growth From 2016 to 2021
Figure 10 The Latin America Zero Discharge Systems Market is Projected to Grow at the Highest CAGR From 2016 to 2021
Figure 11 The North American Region is Estimated to Dominate All the Processes in the Zero Liquid Discharge Systems Market (2016)
Figure 12 The Energy & Power End-Use Industry Segment is Estimated to Account for the Largest Share of the Zero Liquid Discharge Systems Market in 2016
Figure 13 The Zero Liquid Discharge Systems Markets in Brazil and Argentina are Projected to Grow at the Highest CAGR From 2016 to 2021
Figure 14 Stringent Implementation of Various Environmental Regulations to Fuel the Growth of the Zero Liquid Discharge Systems Market From 2016 to 2021
Figure 15 Revenue Pocket Matrix: Zero Liquid Discharge Systems Market, By End-Use Industry, 2016
Figure 16 Revenue Pocket Matrix: Zero Liquid Discharge Systems Market, By Process, 2016
Figure 17 Basic Processes
Figure 18 Zero Liquid Discharge Systems Market: Porters Five Forces Analysis
Figure 19 Crude Oil Production, 2011-2015 (Metric Tons)
Figure 20 Chemical Production Outlook (Excl. Pharmaceuticals), 2017
Figure 21 The Hybrid ZLD Systems Segment is Expected to Lead the Zero Liquid Discharge Systems Market From 2016 to 2021
Figure 22 The Asia-Pacific Conventional Zero Liquid Discharge Systems Market is Projected to Grow at the Highest CAGR From 2016 to 2021
Figure 23 The North American Region is Projected to Lead the Hybrid ZLD Systems Segment of the Zero Liquid Discharge Systems Market From 2016 to 2021
Figure 24 Basic Zero Liquid Discharge Process
Figure 25 The Evaporation & Crystallization Process Segment is Projected to Lead the Zero Liquid Discharge Systems Market From 2016 to 2021
Figure 26 Energy & Power is Expected to Drive the Zero Liquid Discharge Systems Market From 2016 to 2021
Figure 27 North America to Lead the Energy & Power Segment in the Zero Liquid Discharge Systems Market From 2016 to 2021
Figure 28 Asia-Pacific Market is Projected to Register High Growth in Chemicals & Petrochemicals Segment in the Zero Liquid Discharge Systems Market From 2016 to 2021
Figure 29 Food & Beverages Market for Zero Liquid Discharge Systems to Lead North America From 2016 to 2021
Figure 30 Europe to Lead the Textiles Market for Zero Liquid Discharge Systems From 2016 to 2021
Figure 31 North America Projected to Lead the Pharmaceuticals Market for Zero Liquid Discharge Systems From 2016 to 2021
Figure 32 North America Projected to Lead the Semiconductors & Electronics Market for Zero Liquid Discharge Systems From 2016 to 2021
Figure 33 North America Projected to Lead the Other Industries Market for Zero Liquid Discharge Systems From 2016 to 2021
Figure 34 Developing Regions are Expected to Emerge as New Strategic Locations
Figure 35 North America Zero Liquid Discharge Systems Market Snapshot
Figure 36 Europe Zero Liquid Discharge Systems Market Snapshot
Figure 37 Asia-Pacific Zero Liquid Discharge Systems Market Snapshot
Figure 38 Dive Chart
Figure 39 GE Water & Process Technologies: Company Snapshot
Figure 40 Veolia Water Technologies: Company Snapshot
Figure 41 GEA Group AG: Business Overview
Figure 42 Praj Industries Ltd.: Company Snapshot
The zero liquid discharge systems market is projected to grow from an estimated USD 4.67 Billion in 2016 to USD 6.88 Billion by 2021, at a CAGR of 8.1% from 2016 to 2021. Rising concerns over the disposal of brine concentrates into oceans is expected to drive the zero liquid discharge systems market. Growing demand from the Latin America region from end-use industries such as energy & power is also expected to fuel the demand for zero liquid discharge systems.
The zero liquid discharge systems market has been segmented on the basis of system, process, end-use industry, and region. Based on system, the conventional ZLD system segment led the zero liquid discharge systems market in 2015, owing to its applications across various end-use industries. Based on process, the evaporation & crystallization segment formed the major share in zero liquid discharge systems market in 2015. Based on end-use industry, the energy & power segment led the zero liquid discharge systems market in 2015, owing to regulations prohibiting the discharge of concentrated effluents in water streams. Demand for fresh water and the implementation of stringent environmental regulations across the globe is driving the demand for zero liquid discharge systems.
The North America region led the zero liquid discharge systems market in 2015, which is expected to grow at a high rate during the forecast period, owing to the increasing demand for zero liquid discharge systems from the U.S., Canada, and Mexico. High demand from end-use industries such as energy & power, chemicals & petrochemicals, and food & beverages are driving the growth of zero liquid discharge systems markets in these countries.
The capital expenditure (CAPEX) and operating expenses (OPEX) of zero liquid discharge systems are high.
Therefore, zero liquid discharge systems market growth is restrained due the high costs of installation and operation of the systems. In addition, lack of awareness regarding the disposal of wastewater concentrates in various regions, such as the Middle East & Africa and Latin America is a major challenge in the growth of zero liquid discharge systems market.
Aquatech International LLC (U.S.), GE Water Process & Technologies (U.S.), Veolia Water Technologies (France), GEA Group (Germany), Praj Industries Ltd. (India), H2O GmbH (Germany), U.S. Water Services (U.S.), Aquarion AG (Switzerland), Doosan Hydro Technology LLC (U.S.), Petro Sep Corporation (Canada), and Saltworks Technologies Inc. (Canada), among others are the major players in the zero liquid discharge systems market. These players have been focusing on developmental strategies such as contracts, mergers & acquisitions, expansions, and divestments that have helped them to expand their businesses in untapped and potential markets.
To speak to our analyst for a discussion on the above findings, click Speak to Analyst
We will customize the research for you, in case the report listed above does not
meet with your exact requirements. Our custom research will comprehensively cover
the business information you require to help you arrive at strategic and profitable
business decisions.
Please visit https://www.marketsandmarkets.com/knowledge-process-outsourcing-services.asp to specify your custom Research Requirement

